 English
  Русский
 Bahasa Indonesia
 Bahasa Malay
 ไทย
ไทย Español
 Deutsch
 Български
 Français
 Tiếng Việt
 中文
中文 বাংলা
বাংলা हिन्दी
 Čeština
 Українська
 Română

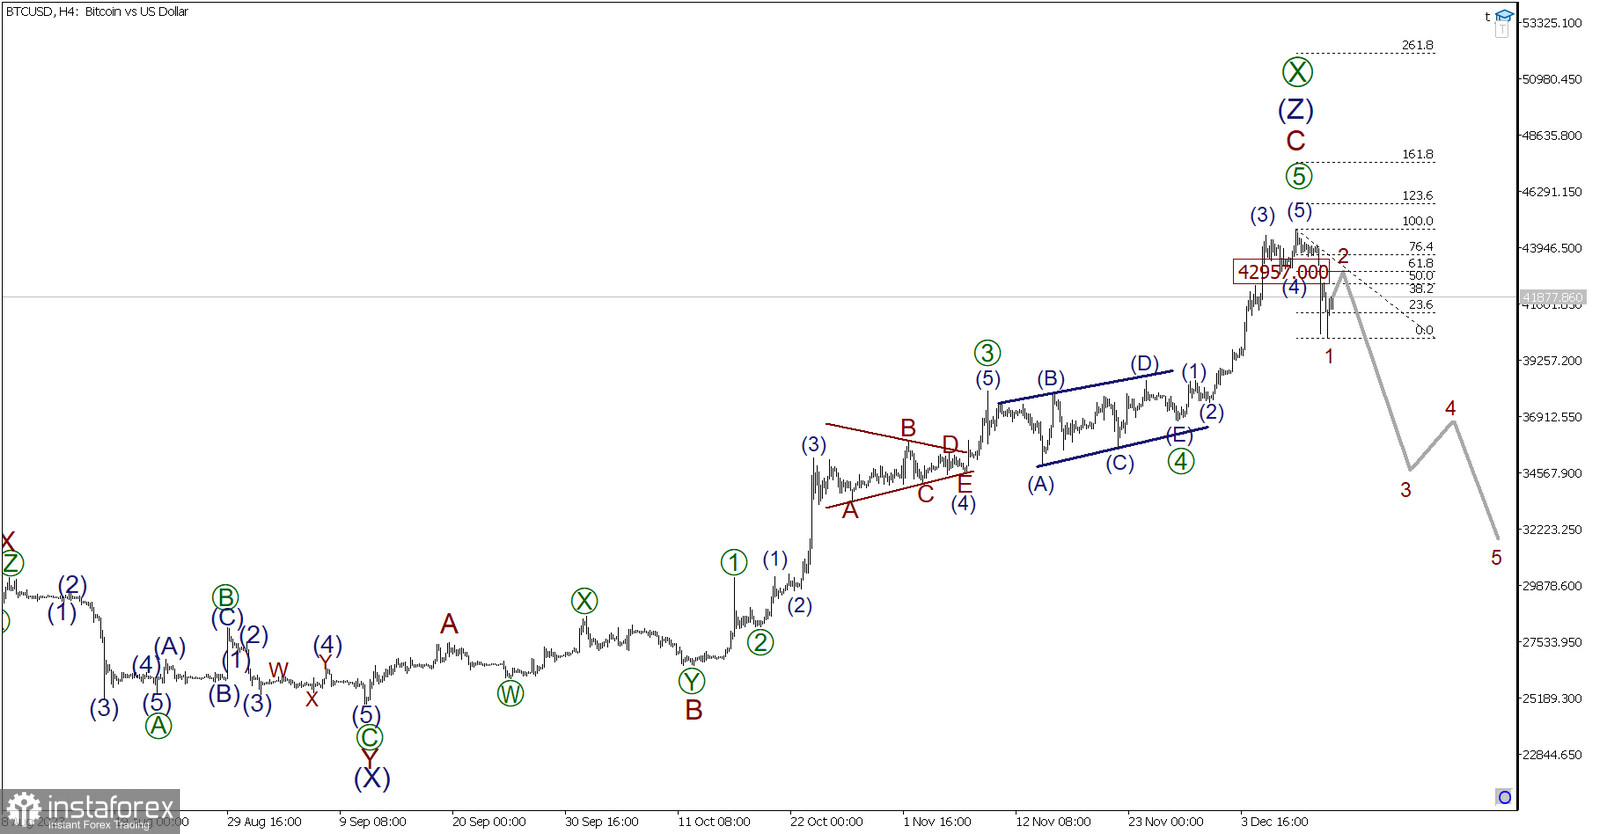
Why did the price of Bitcoin suddenly start to decline? Let's analyze the situation on a four-hour timeframe.
From a wave theory perspective, a significant correction wave [X] may have completed. Bulls spent a considerable amount of time forming this wave, and at the moment, it appears to be a completed triple zigzag.
Thus, we are currently witnessing a decline in the initial part of a new bearish trend. On a smaller wave level, there may be the development of an impulse wave 1-2-3-4-5. The first sub-wave 1 might have recently been completed, so in the coming days, the price may experience a slight upward movement in a minor correction 2.
The magnitude of correction 2 could be 61.8% of wave 1. Accordingly, reaching the level of 42,957.00, the market will likely reverse and fall more actively in the third wave.
In the current situation, you can consider opening a small long position to capitalize on the corrective rise or wait for the completion of wave 2 and initiate a short position at the beginning of wave 3.
Trading recommendations: Buy at 41,877.86, Take profit at 42,957.00.