EUR/USD

Higher Timeframes
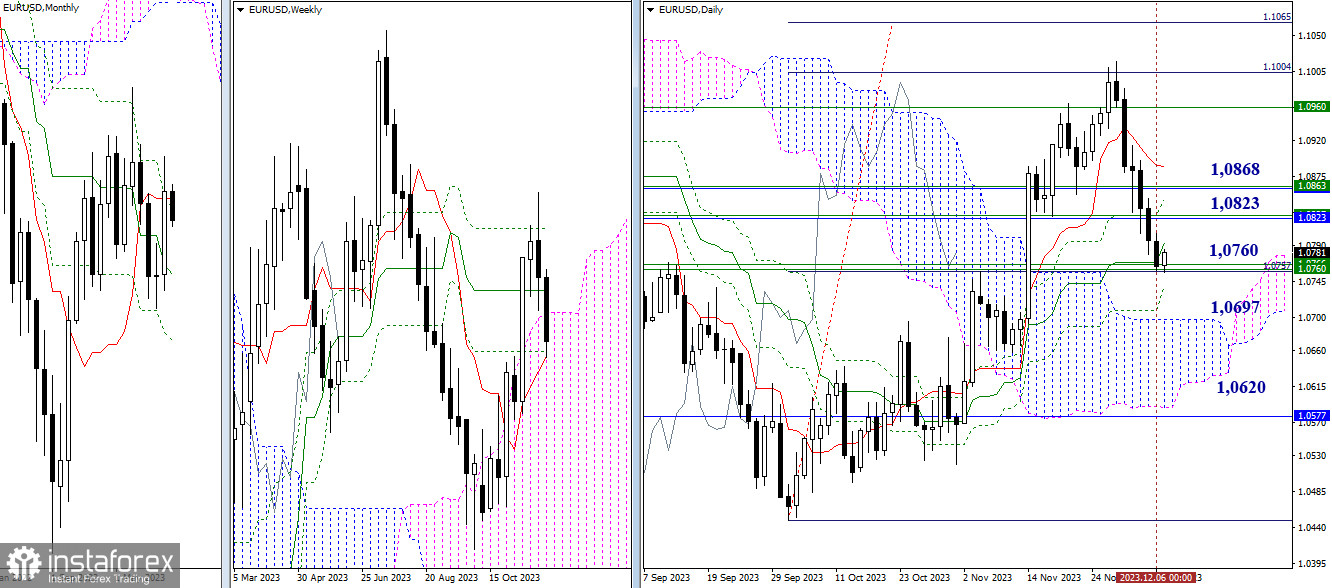
The decline continues. The pair is close to the point where the current correction may lead to the complete elimination of the daily golden cross. In addition to this task, there is currently a question of returning to the bearish side of two weekly levels: 1.0765 (Fibonacci Kijun) and 1.0757 (short-term trend). A breakdown and reliable consolidation below will open the way to new perspectives for the daily cloud (1.0697 – 1.0620) and the monthly medium-term trend (1.0577). A rebound from the encountered reinforced support zone will lead to a retest of the levels passed yesterday, consolidating their efforts in the range of 1.0823 – 1.0863.

H4 – H1
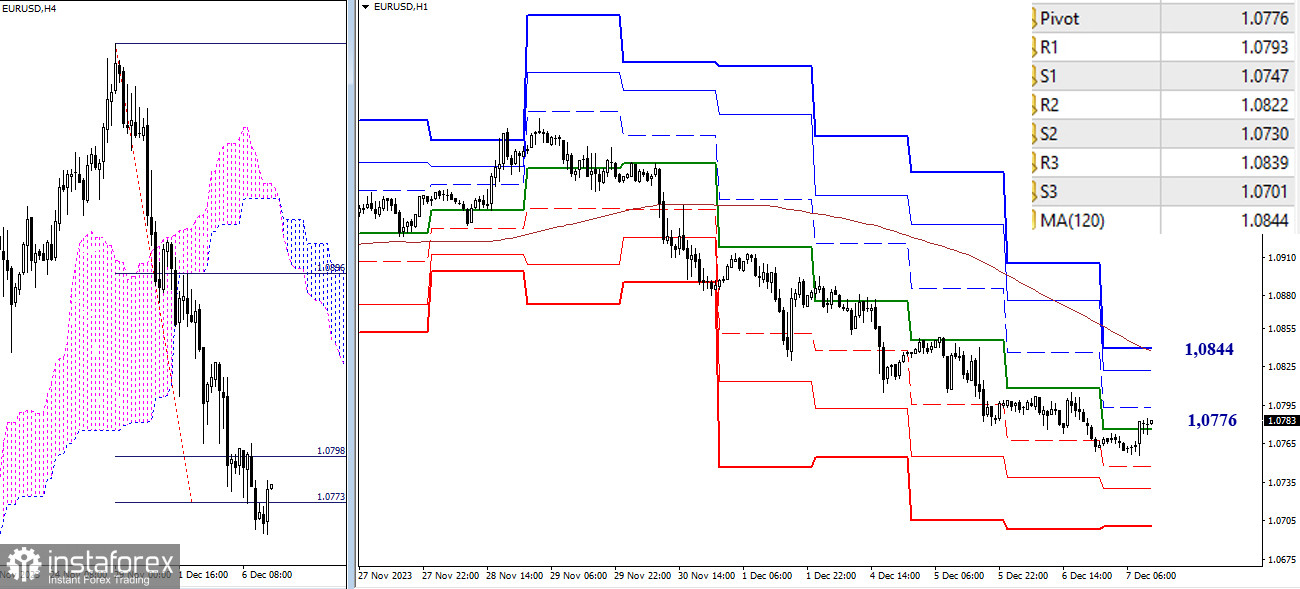
On lower timeframes, the downward target for breaking the H4 cloud has been worked out. A new corrective movement is emerging. Currently, the central pivot point of the day (1.0776) is being tested. Failure in the correction and resumption of the downward trend (1.0756) will return the relevance to bearish targets. Within the day, these are the supports of classic pivot points (1.0747 – 1.0730 – 1.0701). The development of an upward correction and the strengthening of bullish sentiments will lead to the testing of bullish targets. The main role in this is played by the weekly long-term trend (1.0844), and this level is responsible for the current balance of power and the main advantage. Intermediate resistance on this path may be provided by the resistances of classic pivot points (1.0793 – 1.0822).
***
GBP/USD

Higher Timeframes
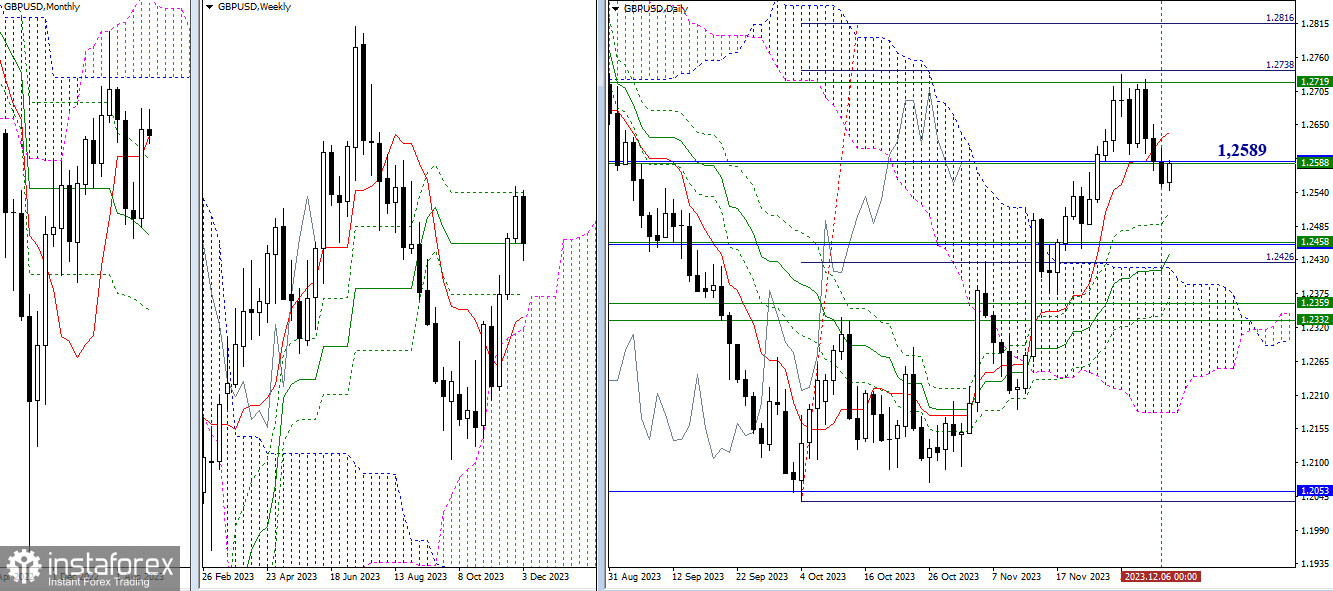
Over the past day, bearish players closed below the tested supports of 1.2589 (weekly medium-term trend) and 1.2587 (monthly short-term trend). A breakdown and the preservation of dominance will allow bearish players to focus on tasks for the elimination of the golden cross of the daily Ichimoku cloud. The medium-term trend of the cross (1.2440) is now reinforced by the supports of the Fibonacci Kijuns of weekly and monthly timeframes, converging at the level of 1.2458. If the attraction of 1.2589-87 now maintains its influence on the market, and the pair remains in its attraction zone, not confirming the breakdown, then we can expect a retest of the daily short-term trend (1.2637), followed by a new rise to the resistance of the weekly Fibonacci Kijun (1.2719).

H4 – H1
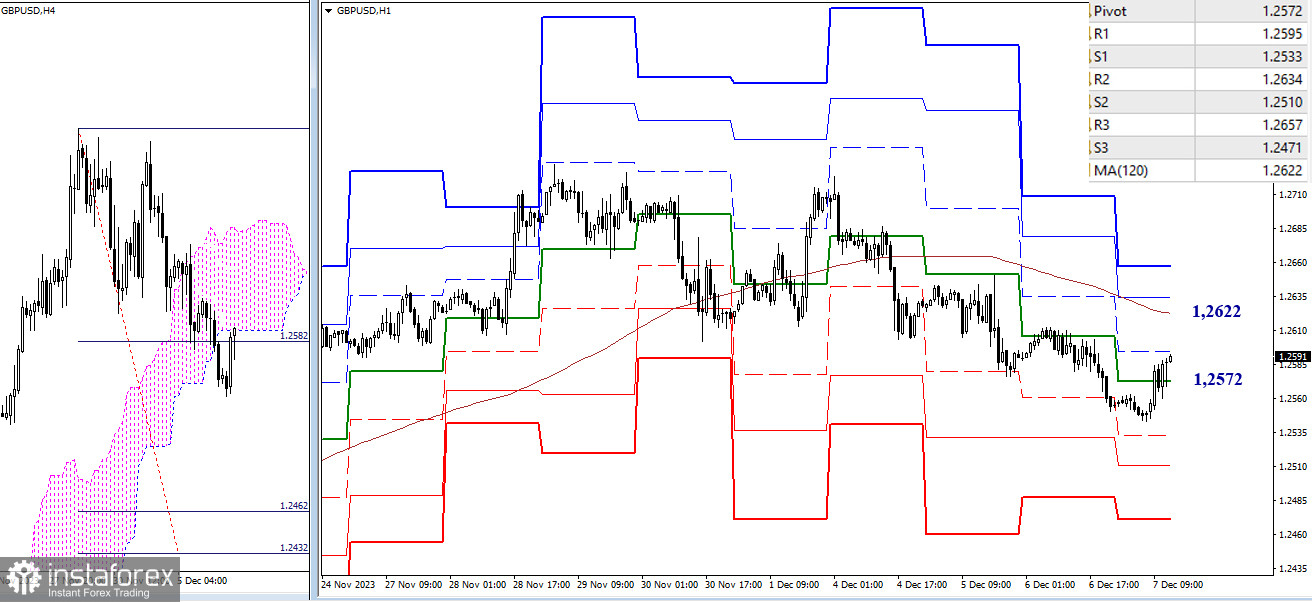
Currently, on lower timeframes, we observe the development of a corrective rise. The testing of R1 (1.2595) is approaching, then all attention will be directed towards passing the weekly long-term trend (1.2622). A breakout and a reversal of the moving average can change the current balance of power. In this case, the next bullish targets will be the resistances of classic pivot points (1.2634 – 1.2657). In case the correction is completed, the market will return to the decline, with the relevant bearish targets initially being the resistances of classic pivot points (1.2533 – 1.2510 – 1.2471), and then the target for breaking the H4 cloud (1.2462 – 1.2432) will come into the zone of bearish interests.
***
The technical analysis of the situation uses:
Higher timeframes - Ichimoku Kinko Hyo (9.26.52) + Fibonacci Kijun levels
Lower timeframes - H1 - Pivot Points (classic) + Moving Average 120 (weekly long-term trend)
 English
 Русский
 Bahasa Indonesia
 Bahasa Malay
 ไทย
ไทย Español
 Deutsch
 Български
 Français
 Tiếng Việt
 中文
中文 বাংলা
বাংলা हिन्दी
 Čeština
 Українська
 Română

