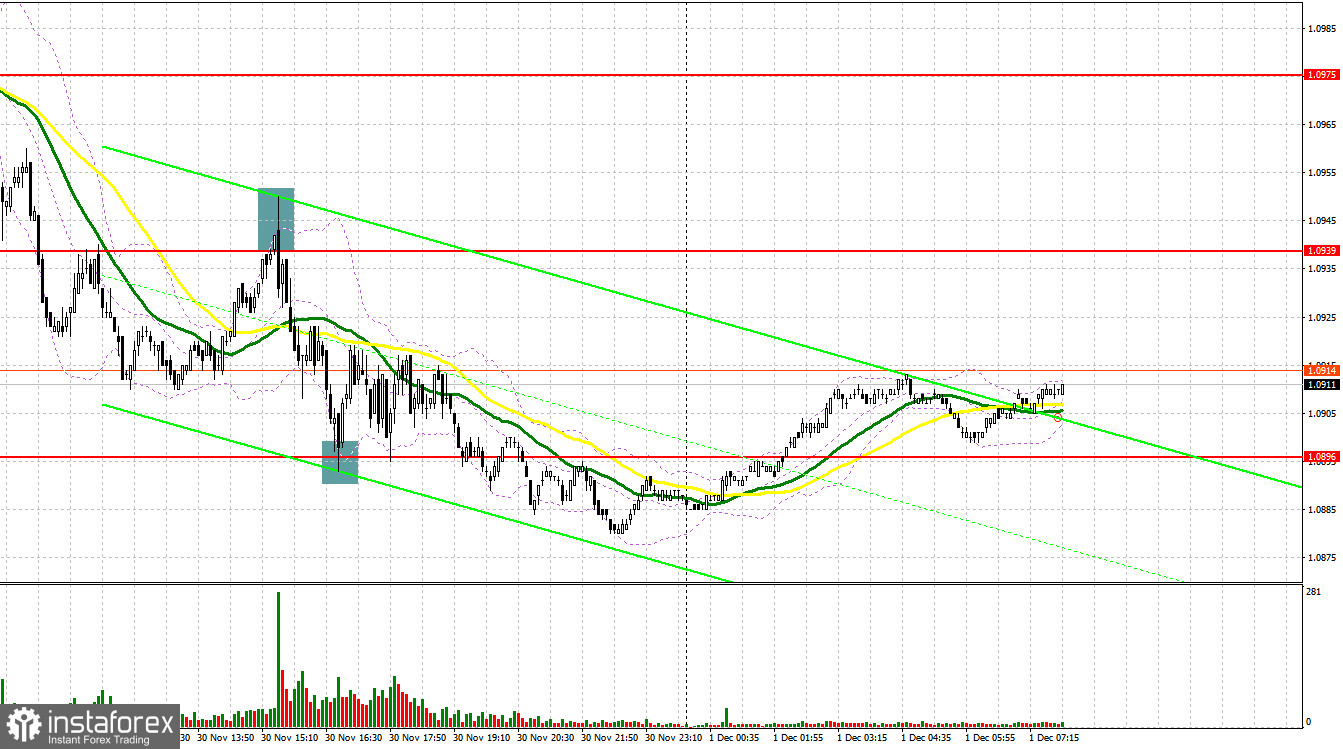
Yesterday, the pair formed several entry signals. Let's have a look at what happened on the 5-minute chart. In my morning review, I mentioned the level of 1.0962 as a possible entry point. A breakthrough and an upward retest of this range generated a sell signal, which sent the pair down by more than 30 pips. Safeguarding the support at 1.0929 produced a buy signal, but after a minor correction, the pressure on the pair returned, which led to losses on the trade. In the afternoon, a failed consolidation above 1.0939 and a sell signal sent the pair down by more than 30 pips. Buying near the support at 1.0896 pushed the euro higher by 20 pips, and that was the end of it.

For long positions on EUR/USD:
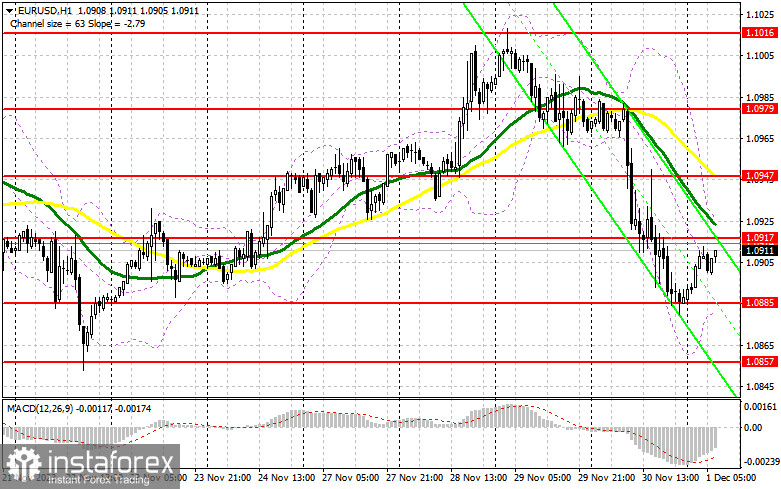
The euro fell after reports that eurozone inflation was well below economists' expectations, and the US Federal Reserve's preferred inflation gauge, called the personal consumption expenditures price index, matched forecasts. From a technical perspective, a minor bearish correction at the end of the month was also expected, so there was nothing to be surprised about. Today, we are waiting for a number of reports on Manufacturing PMIs in the eurozone countries, which may exert pressure on the pair. In addition, European Central Bank President Christine Lagarde's soft stance after yesterday's inflation data will be another reason for the euro to fall at the end of the week. For this reason, I intend to act on dips to the support area of 1.0885, where I expect large buyers to step in. A false breakout on this mark will generate a buy signal in anticipation of growth and a test of the new resistance at 1.0917, established yesterday. A breakout and a downward retest of this area will depend on Lagarde's statements, and this may produce a buy signal, paving the way to 1.0947. This is in line with the bearish moving averages. The highest target will be the area of 1.0979, where I will take profits. In the scenario of a decrease in EUR/USD and the absence of activity at 1.0885 in the first half of the day, the instrument will move into a new descending channel, which will create more problems for the bulls. In such a case, it will be possible to enter the market after forming a false breakout near 1.0857. I will open long positions immediately on a rebound from 1.0827, bearing in mind an upward correction of 30-35 pips within the day.
For short positions on EUR/USD:
The sellers achieved their goal yesterday, maintaining control of the market. To support the downward correction, it is necessary to stay below 1.0917, and form a false breakout at this level after weak data on the eurozone Manufacturing PMI. This will generate an excellent sell signal in anticipation of a new, albeit short-term, bear market. The nearest target will be the support at 1.0885. Only a breakout and consolidation below this range, as well as an upward retest, will lead to another sell signal at 1.0857. The lowest target will be the low of 1.0827, where I will take profits. In case of an upward movement of EUR/USD during the European session, amid tough statements from Lagarde despite yesterday's inflation data, as well as the absence of the bears at 1.0917, the bulls will try to stop the corrective movement and bring balance to the market. This will open the way for the buyers to the high of 1.0947. There, selling is also possible but only after a failed consolidation. I will open short positions immediately on a rebound from 1.0979 aiming for a downward correction of 30-35 pips.

COT report:
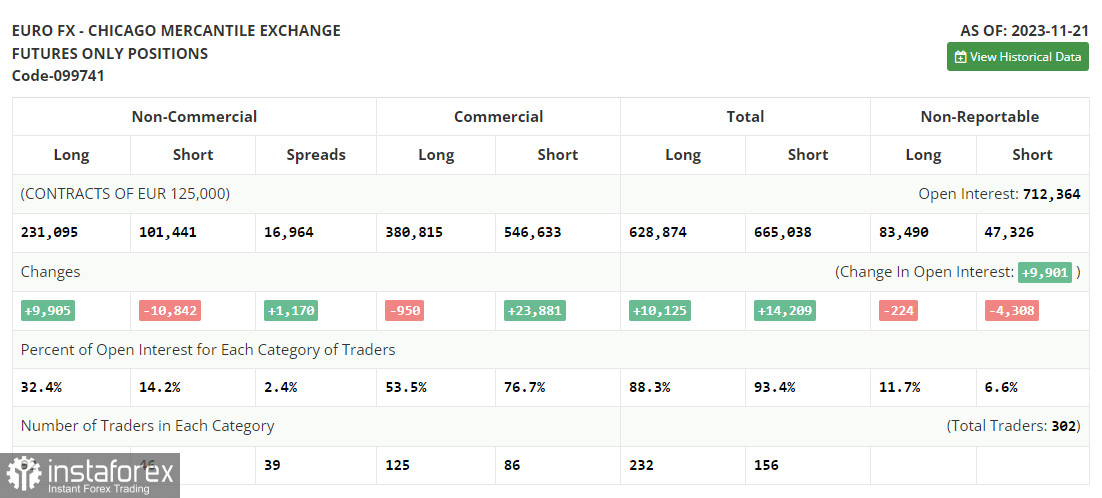
In the COT report (Commitment of Traders) for November 21, there was an increase in long positions and another significant decline in short positions. Statements by ECB policymakers and their commitment to high interest rates encouraged traders to add long positions on EUR/USD last week. Besides, a series of PMI reports also demonstrated a slight recovery in some eurozone countries, leaving a chance to avoid a recession in Q4 of this year. The minutes of the Federal Reserve's November meeting slightly dampened the zeal of the buyers of risky assets but did not particularly affect the development of the bullish trend. Soon, a lot of important fundamental statistics on inflation and consumer confidence will be released, which will definitely affect the market direction. The COT report indicated that long non-commercial positions grew by 9,905 to 231,095, while short non-commercial positions decreased by 10,842 to 101,441. As a result, the spread between long and short positions increased by 1,170. EUR/USD closed on Friday higher at 1.0927 compared to 1.0902 a week ago.

Indicator signals:
Moving averages:
The instrument is trading below the 30 and 50-day moving averages. It indicates that EUR/USD is likely to decline lower.
Please note that the time period and levels of the moving averages are analyzed only for the H1 chart, which differs from the general definition of the classic daily moving averages on the D1 chart.
Bollinger Bands
If EUR/USD declines, the indicator's lower border near 1.0885 will serve as support.
Description of indicators:
• A moving average of a 50-day period determines the current trend by smoothing volatility and noise; marked in yellow on the chart;
• A moving average of a 30-day period determines the current trend by smoothing volatility and noise; marked in green on the chart;
• MACD Indicator (Moving Average Convergence/Divergence) Fast EMA with a 12-day period; Slow EMA with a 26-day period. SMA with a 9-day period;
• Bollinger Bands: 20-day period;
• Non-commercial traders are speculators such as individual traders, hedge funds, and large institutions who use the futures market for speculative purposes and meet certain requirements;
• Long non-commercial positions represent the total number of long positions opened by non-commercial traders;
• Short non-commercial positions represent the total number of short positions opened by non-commercial traders;
• The non-commercial net position is the difference between short and long positions of non-commercial traders.
 English
 Русский
 Bahasa Indonesia
 Bahasa Malay
 ไทย
ไทย Español
 Deutsch
 Български
 Français
 Tiếng Việt
 中文
中文 বাংলা
বাংলা हिन्दी
 Čeština
 Українська
 Română

