Receiving an additional "blow" today from the publication of disappointing inflation data in the Eurozone, the euro is developing a bearish impulse, and the EUR/USD pair is declining, which began during yesterday's European trading session.
According to the data presented today by Eurostat, the annual preliminary Consumer Price Index (CPI) for the Eurozone in November increased by 2.4% (compared to an increase of 2.9% in October and a forecast of 2.7%). Similarly, the core CPI decreased to 3.6% (versus 4.2% in October and a forecast of 3.9%).
The published European inflation indicators sharply strengthened the positions of some of the most aggressive euro sellers, who are already pricing in a reduction in the ECB interest rate by more than 110 basis points in 2024 (compared to about 95 bps the day before). Moreover, the market participants estimate the probability of the first rate cut in April 2024 at about 95%. This is a crucial fundamental bearish factor for the euro and, accordingly, for the EUR/USD pair.

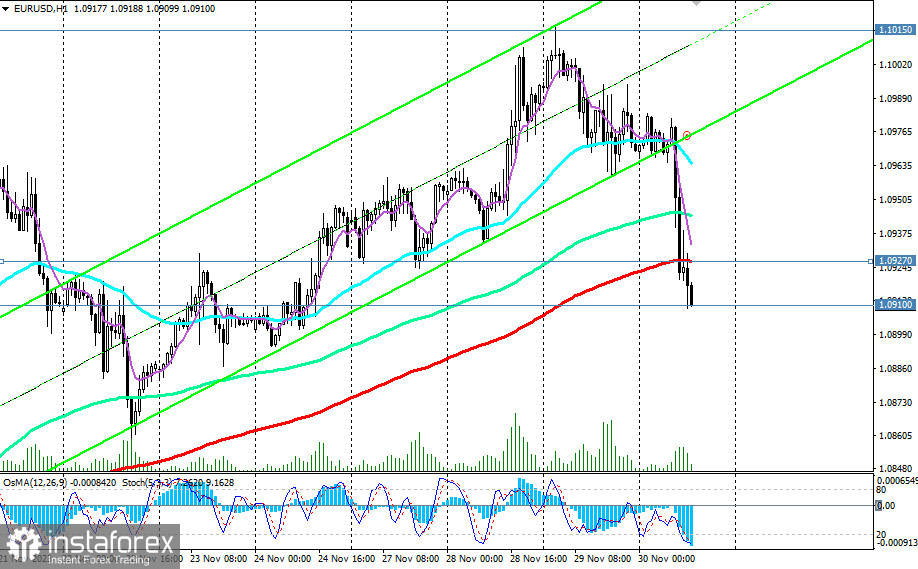
As of writing, the EUR/USD pair was trading near 1.0910, developing a downward trend after breaking through the important short-term support level of 1.0927 (200 EMA on the 1-hour chart).
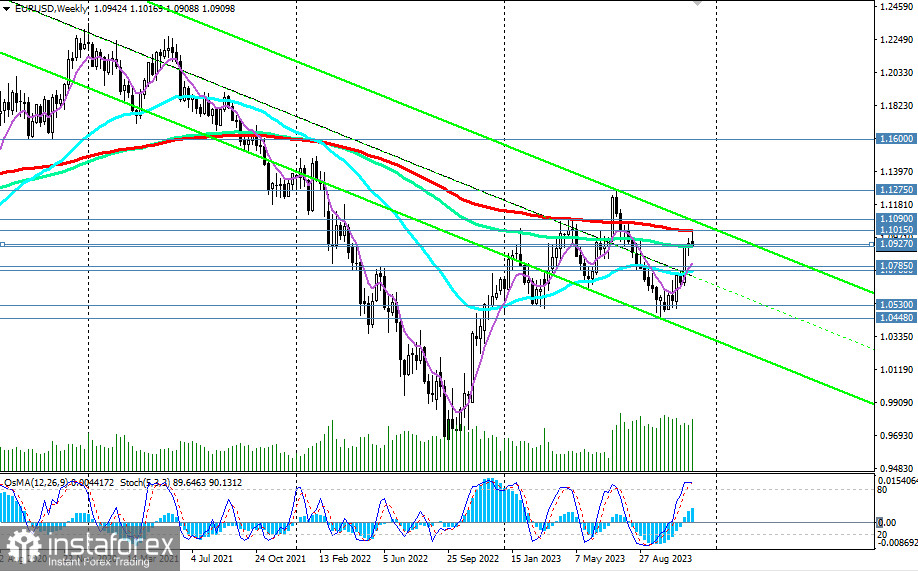
Breaking the important long-term support level of 1.0910 (144 EMA on the weekly chart) will be the second signal of the completion of the upward correction in EUR/USD and the resumption of short positions.
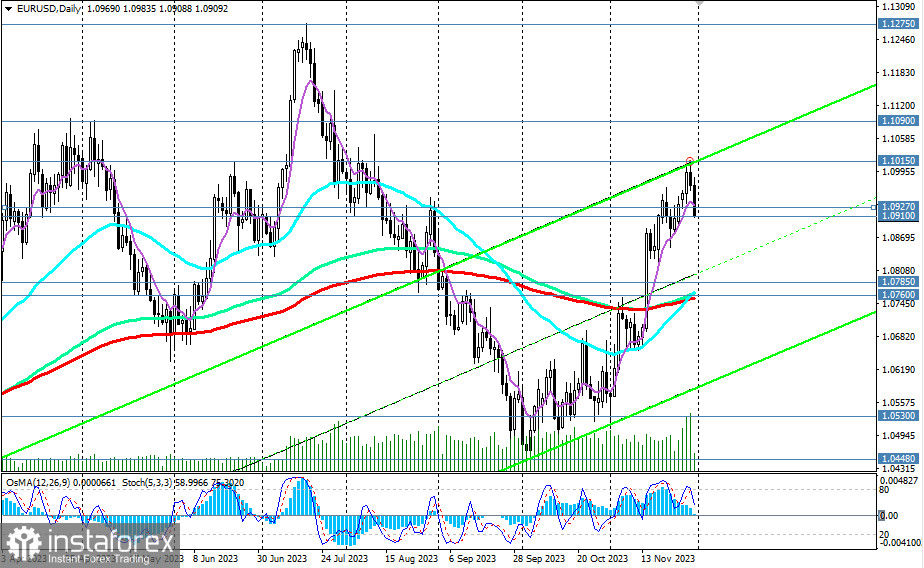
Downside targets include the "round" support level of 1.0800 and the important short-term support level of 1.0785 (200 EMA on the 4-hour chart).

Breaking the key support level of 1.0760 (200 EMA, 144 EMA, 50 EMA on the daily chart) will return EUR/USD to the zone of the medium-term bearish market.
In any case, below the levels of 1.0927, 1.0910, 1.0900, short positions are preferable.
In the alternative scenario, EUR/USD will resume growth. The first signal for new long positions is the breakout of the resistance level of 1.0927, and the confirming level is 1.0945 (144 EMA on the 1-hour chart).
The nearest target for growth is the level of 1.1000, then a retest of resistance at the key level of 1.1015, the breakout of which will bring EUR/USD into the zone of the long-term bullish market.
Trading scenarios:
Sell Stop 1.0890. Stop-Loss 1.0950. Targets 1.0800, 1.0785, 1.0760, 1.0700, 1.0600, 1.0530, 1.0500, 1.0448, 1.0400.
Buy Stop 1.0950. Stop-Loss 1.0890. Targets 1.1000, 1.1015, 1.1090, 1.1200, 1.1275, 1.1300, 1.1400, 1.1500, 1.1600.
"Targets" correspond to support/resistance levels. This also does not mean that they will necessarily be achieved but can serve as a guide when planning and placing your trading positions.
 English
 Русский
 Bahasa Indonesia
 Bahasa Malay
 ไทย
ไทย Español
 Deutsch
 Български
 Français
 Tiếng Việt
 中文
中文 বাংলা
বাংলা हिन्दी
 Čeština
 Українська
 Română

