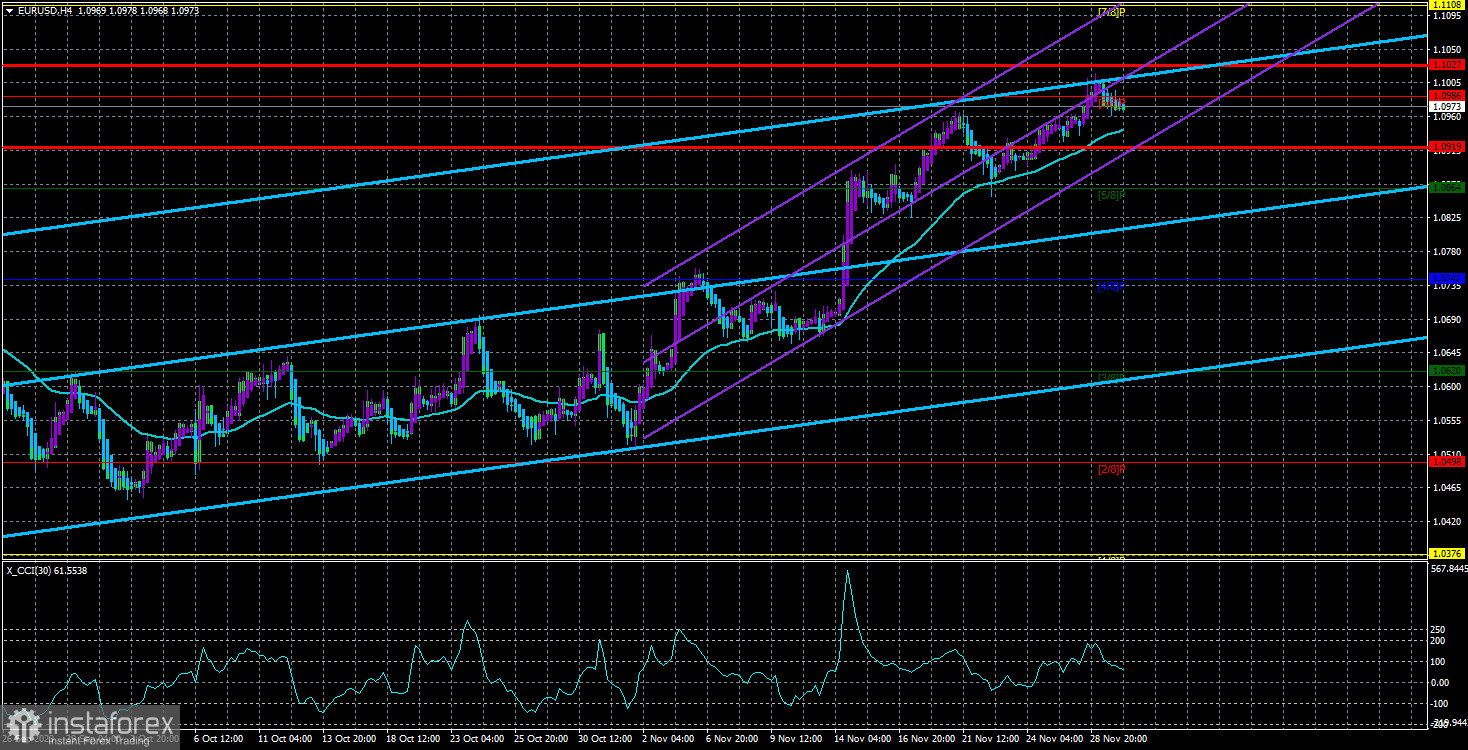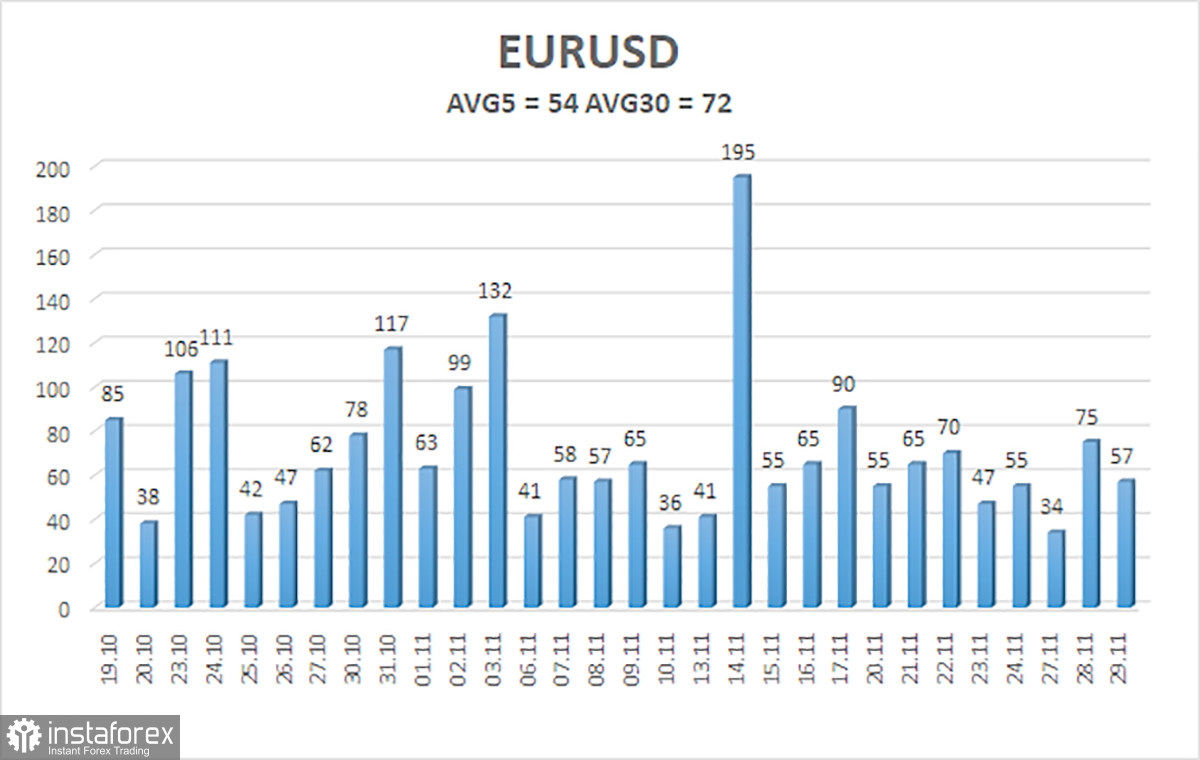
On Wednesday, the EUR/USD pair was practically motionless for the entire day. All we saw during the day was a minimal pullback downward, within which the price couldn't even reach the moving average. This is even though the moving average line runs near the price. In essence, the European currency corrected downward by 30 points, and the overall volatility of the day did not exceed 60 points. It is precisely on the volatility indicator that we will focus our attention on today.
What do the figures below in the table tell us? In 15 out of the last 17 cases, volatility did not exceed 70 points. In most cases, it ranged from 50 to 60 points. What does 60 points in 24 hours mean? Essentially, it means that the pair stood still all day. If it were a deliberate movement in one direction without significant pullbacks within the day, then such movement would be ideal for trading. However, the price stays flat in most cases, and within such movement, it covers 60 points. It is impossible to trade such movement on both lower and higher timeframes profitably.
Next, you can trade the pair on a longer-term basis. The trend we have now is an ascending one. It would seem that you need to open long positions and wait. And everything would be fine if the current rise of the European currency did not raise numerous questions. Even if the euro has certain growth factors, the dollar, at a minimum, also has them. Therefore, buying the pair and waiting for 2-3–4-5 days is dangerous, as the European currency can collapse anytime.
In the 24-hour timeframe, it is visible that all the current movement is a correction against a more significant decline several months ago. And if the current movement is a correction, it will end sooner or later. Therefore, buying the euro for the medium term now is impractical and dangerous.
GDP reports rarely provoke a market reaction. And a strong market reaction - almost never. Historically, reports on inflation or business activity indices are even more important for the market than economic growth indicators. Nevertheless, we want to emphasize to traders that the US GDP is expanding and doing so at a pace exceeding forecasts. This growth occurs in a climate where widespread predictions of a recession persist and are accelerating despite the Federal Reserve maintaining its highest interest rates in decades. It is growing, unlike the British or European economy.
Even the theses mentioned above are enough for the dollar to at least stop falling. Imagine a situation. There is a country where everything is good with the economy, much better than its competitors, but the exchange rate of this country's currency is falling. Illogical? Illogical.
We want to touch on interest rates, which are much higher in the United States than in the European Union. Higher rates mean higher returns on deposits and higher returns on government bonds. Accordingly, demand for the US dollar should rise, not fall.
We still believe that the current rise of the euro is a prolonged correction. Of course, we may be wrong, like others, but the combination of all factors still speaks only of one thing - the dollar should strengthen soon. We don't even remember the triple overbought condition of the CCI indicator, which was ignored by the market. The stronger the euro grows, the more amazing and illogical such a movement will look. Whether to trade it or not - traders must decide for themselves.

The average volatility of the EUR/USD currency pair for the last five trading days as of November 30 is 54 points and is characterized as "average." Thus, we expect the pair to move between the levels of 1.0919 and 1.1027 on Thursday. The downward reversal of the Heiken Ashi indicator indicates a possible turn of the downward correction.
Nearest support levels:
S1 - 1.0864
S2 - 1.0742
S3 - 1.0620
Nearest resistance levels:
R1 - 1.0986
R2 - 1.1108
R3 - 1.1230
Trading recommendations:
The EUR/USD pair continues its new upward movement and is above the moving average. At this time, one should consider buying, but we still believe that the current rise is illogical, and therefore it may end in a collapse. Based on "naked" technical analysis, one can stay in long positions with targets at 1.1027 and 1.1108 until the price consolidates below the moving average. Selling the euro will become relevant after the price consolidates below the moving average, with the target at 1.0864.
Explanations for illustrations:
Linear regression channels - help determine the current trend. If both are directed in the same direction, the trend is strong.
The moving average line (settings 20.0, smoothed) - determines the short-term trend and direction in which trading should be conducted.
Murray levels - target levels for movements and corrections.
Volatility levels (red lines) - the probable price channel in which the pair will move the next day, based on current volatility indicators.
CCI indicator - its entry into the oversold area (below -250) or overbought area (above +250) indicates that a trend reversal is approaching in the opposite direction.
 English
 Русский
 Bahasa Indonesia
 Bahasa Malay
 ไทย
ไทย Español
 Deutsch
 Български
 Français
 Tiếng Việt
 中文
中文 বাংলা
বাংলা हिन्दी
 Čeština
 Українська
 Română

