The dollar did not show a pronounced growth despite the fact that the second estimate of the United States GDP for the third quarter turned out significantly better than the first, showing economic growth not at 2.7%, but at 3.0%. On the other hand, the pound stood still. Such a reaction, to some extent, hints at the continuing interest in the dollar's broad weakness. However, today the sentiment may change. Everything will depend on the eurozone data, and the forecasts are negative. In particular, the unemployment rate may rise from 6.5% to 6.6%. But what is more important is inflation, which may slow down from 2.9% to 2.7%. And this will make investors pay attention to the European Central Bank, which, given such data, may start reducing interest rates earlier than the Federal Reserve. This could be a reason for a reversal and the beginning of a prolonged upward movement for the dollar.

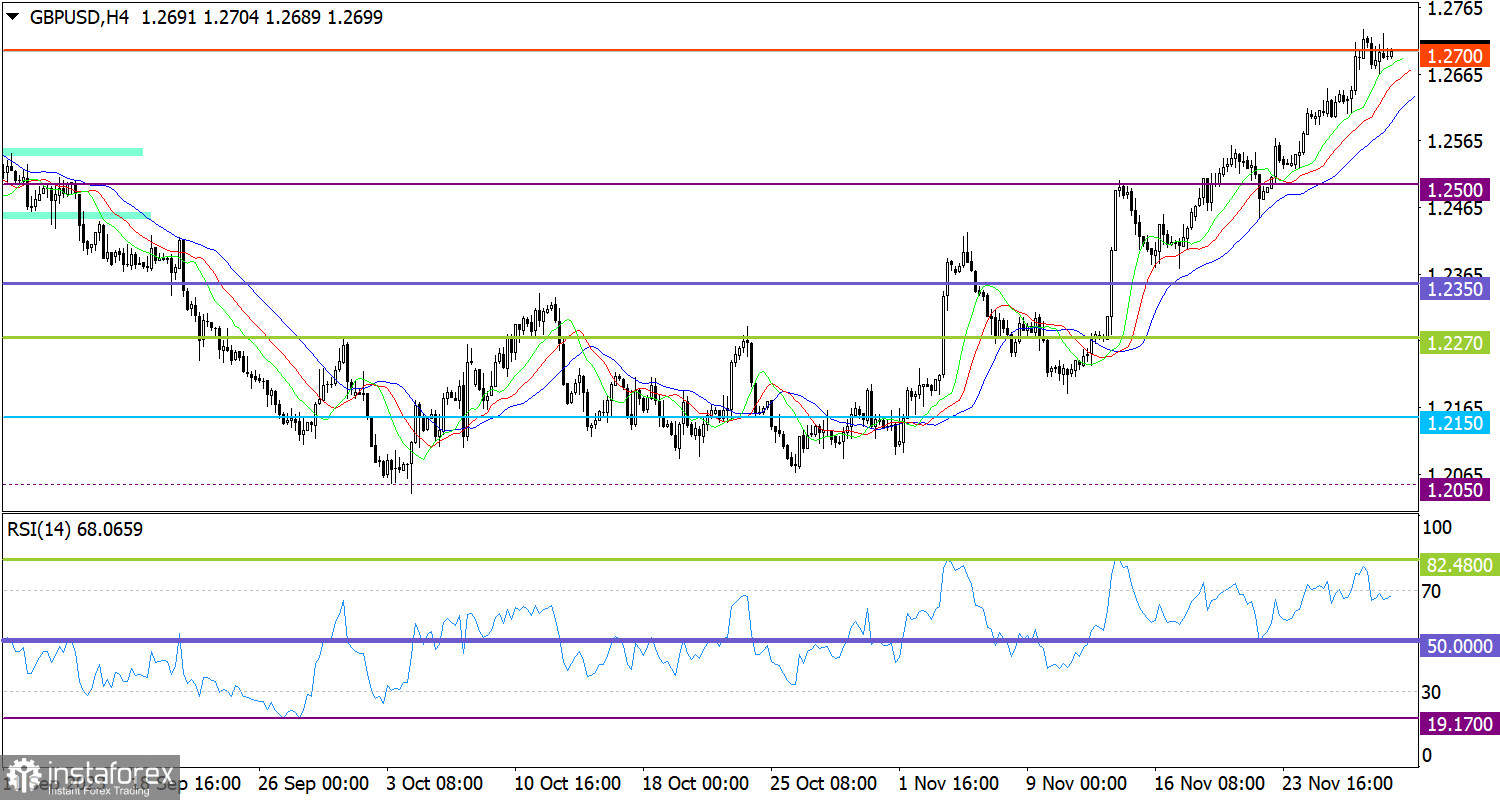
The volume of long positions for the GBP/USD pair fell around the resistance level of 1.2700. This led to a pullback, followed by a stagnation along the established level, indicating the prevailing bullish sentiment.
On the four-hour chart, the RSI technical indicator shows that the indicator line has moved from the overbought territory. However, it is hovering in the 50/70 area, indicating a bullish bias.
On the same time frame, the Alligator's MAs are headed upwards, which reflects the quote's movement.
Outlook
The current phase could indicate that the balance of trading forces may shift, which in the theory of technical analysis, could lead to extending the upward cycle. However, in order to increase the volume of long positions, it is not enough to just settle around the level of 1.2700; it is also necessary to update the local high. Otherwise, the level of 1.2700 may play the role of resistance, which may form a corrective move towards 1.2600.
Comprehensive indicator analysis indicates sideways movement in the short-term period. Meanwhile, the bullish signal persists in the intraday and medium-term periods.
 English
 Русский
 Bahasa Indonesia
 Bahasa Malay
 ไทย
ไทย Español
 Deutsch
 Български
 Français
 Tiếng Việt
 中文
中文 বাংলা
বাংলা हिन्दी
 Čeština
 Українська
 Română

