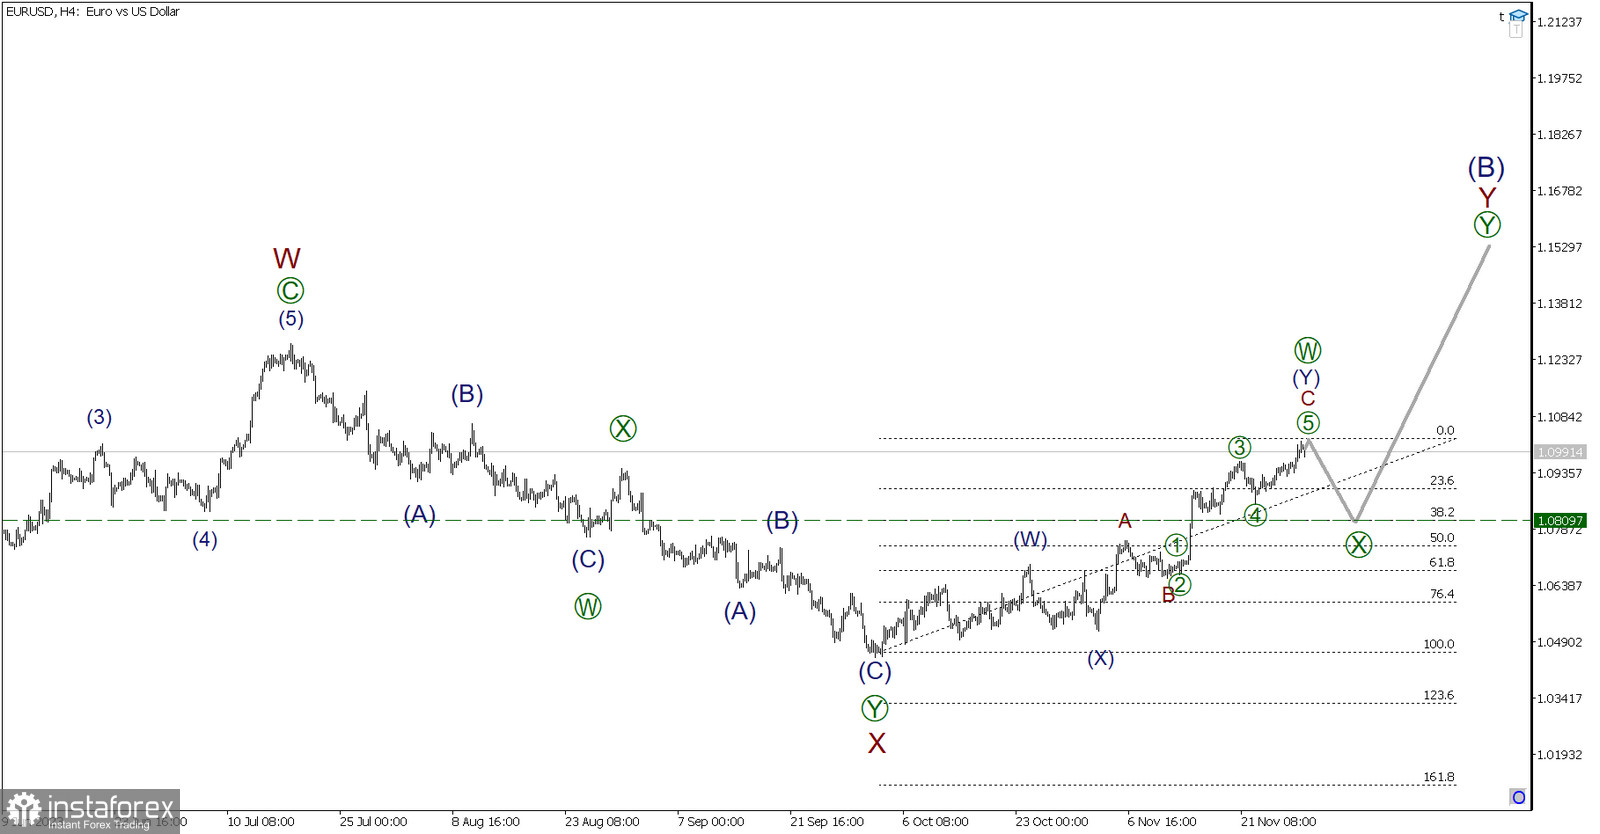
The situation in the currency pair is being analyzed from the perspective of wave analysis on a four-hour timeframe. In the medium-term outlook for the EUR/USD pair, a large corrective wave (B) is likely forming with a complex internal structure. It could well take the form of a double zigzag W-X-Y.
The first active wave W is completed in the form of a standard zigzag, after which the price corrected in a connecting wave X, which has a complex structure. Wave [X] appears to be a double zigzag [W]-[X]-[Y].
As of writing, the market is likely in the active wave Y, more precisely at its very beginning. Presumably, the current active wave [W] is being constructed, consisting of sub-waves (W)-(X)-(Y). It is possible that [W] is about to end, and market participants will witness a decrease in price in the connecting wave [X]. Today's news with GDP and crude oil inventory data could accelerate the start of the bearish wave.
In the current situation, with confirmation of the downward wave [X], opening short positions with a take-profit at the level of 1.0809 can be considered. At this price level, the magnitude of wave [X] will be 38.2% of [W]. Correction waves of this magnitude are often encountered in double zigzags.
Trading recommendations: Sell at 1.0991, take profit at 1.0809.
 English
 Русский
 Bahasa Indonesia
 Bahasa Malay
 ไทย
ไทย Español
 Deutsch
 Български
 Français
 Tiếng Việt
 中文
中文 বাংলা
বাংলা हिन्दी
 Čeština
 Українська
 Română

