EUR/USD

Higher Timeframes
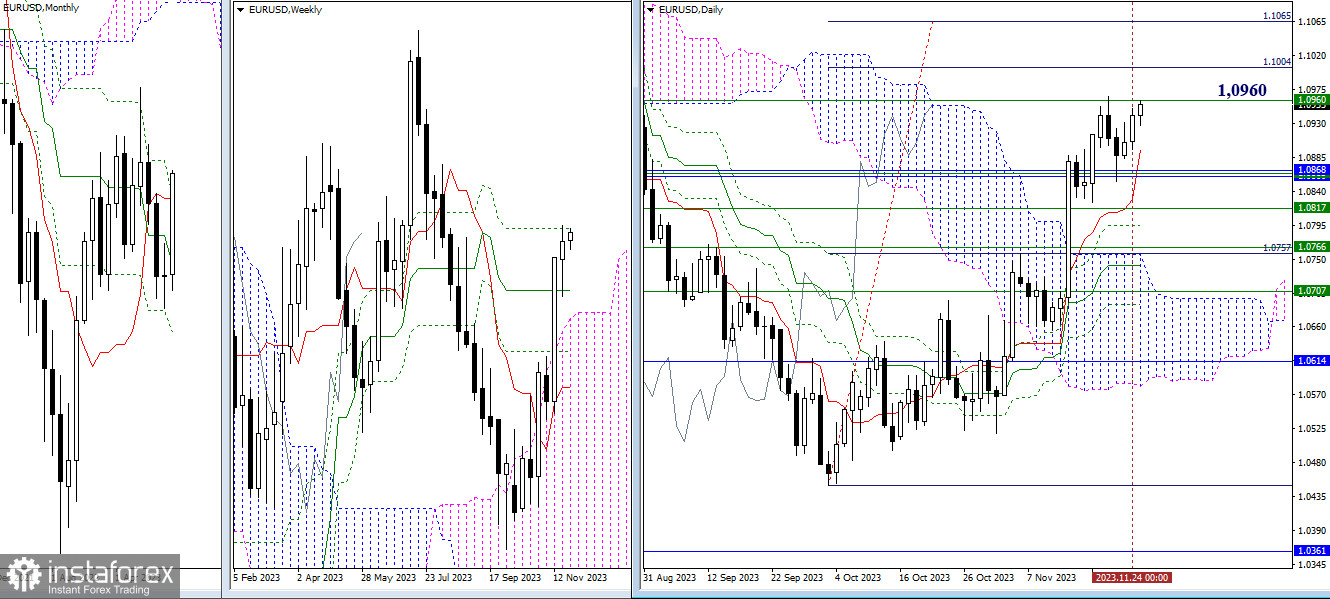
Testing the final level of last week's death cross of the Ichimoku cloud (1.0960) did not yield a positive result for bullish players. Today, they are making a second attempt and retesting the resistance at 1.0960. Overcoming this level will open the possibility of achieving the daily target for breaking through the Ichimoku cloud (1.1004 – 1.1065). Another failure could bring the market back to accumulation of support around 1.0862 – 1.0868 (monthly levels + weekly medium-term trend), with intermediate support potentially provided by the daily short-term trend (1.1096).

H4 – H1
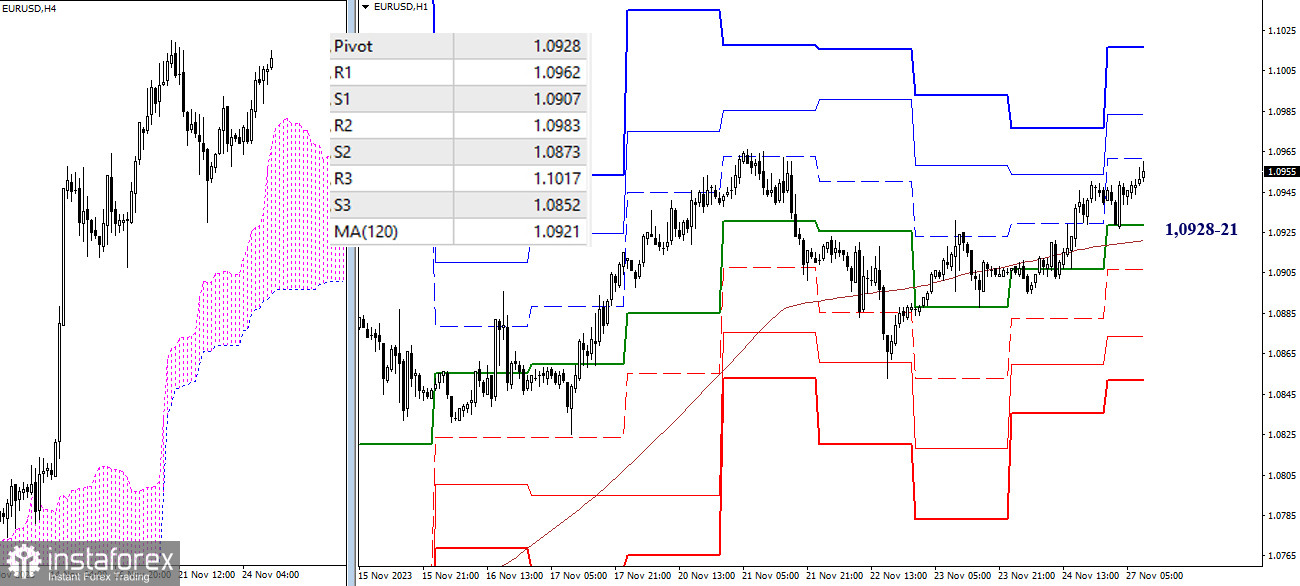
Currently, on the lower timeframes, the advantage belongs to bullish players who are close to testing the first resistance of classic pivot points (1.0962), followed by R2 (1.0983) and R3 (1.1017). The key levels today act as supports, uniting their efforts around 1.0928-21 (central pivot point + weekly long-term trend). Consolidation below these levels and a reversal of the moving average will change the current balance of power. Classic pivot points at 1.0907 – 1.0873 – 1.0852 will serve as supports. Further decline and solidifying the result will lead to a full rebound from the tested higher timeframe resistance at 1.0960.
***
GBP/USD

Higher Timeframes
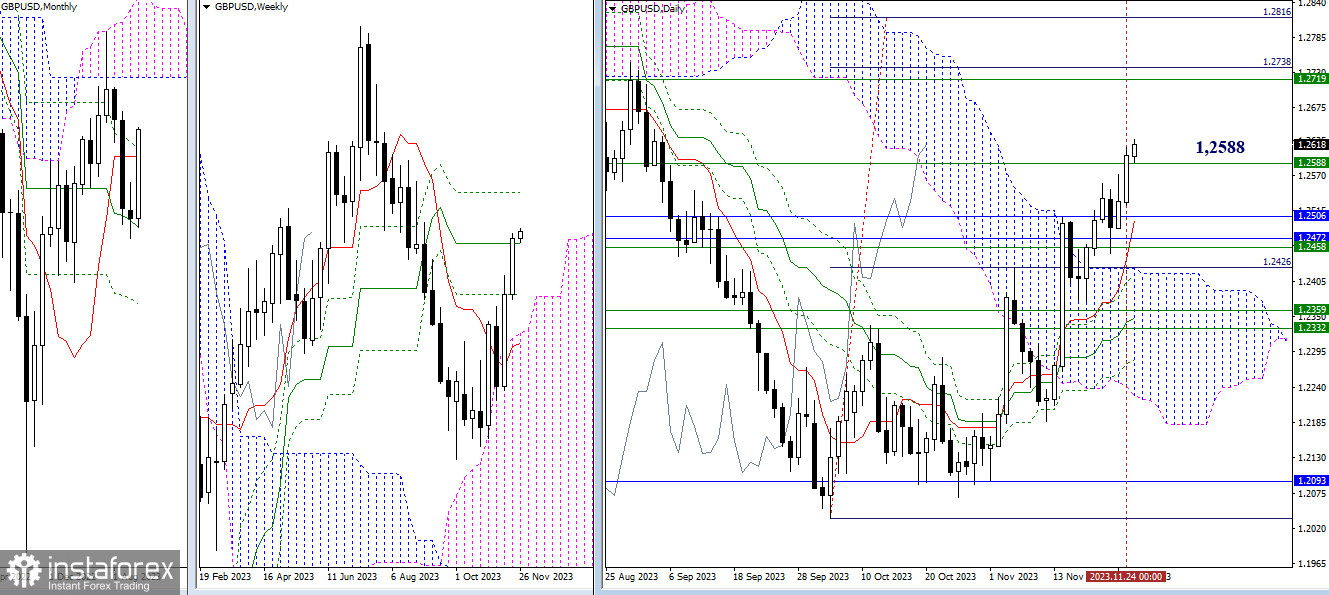
Bullish players closed last week above the weekly medium-term trend (1.2588). Continuing the ascent will lead the market to the resistance of the final level of the death cross of the weekly Ichimoku cloud (1.2719) and to the daily target for breaking through the cloud (1.2738 – 1.2816). In case of losing the current center of attraction (1.2588) and a resumption of the decline, bears will return to a well-fortified and broad support zone at 1.2506 – 1.2500 – 1.2472 – 1.2458 (monthly levels + daily short-term trend + weekly medium-term trend).

H4 – H1
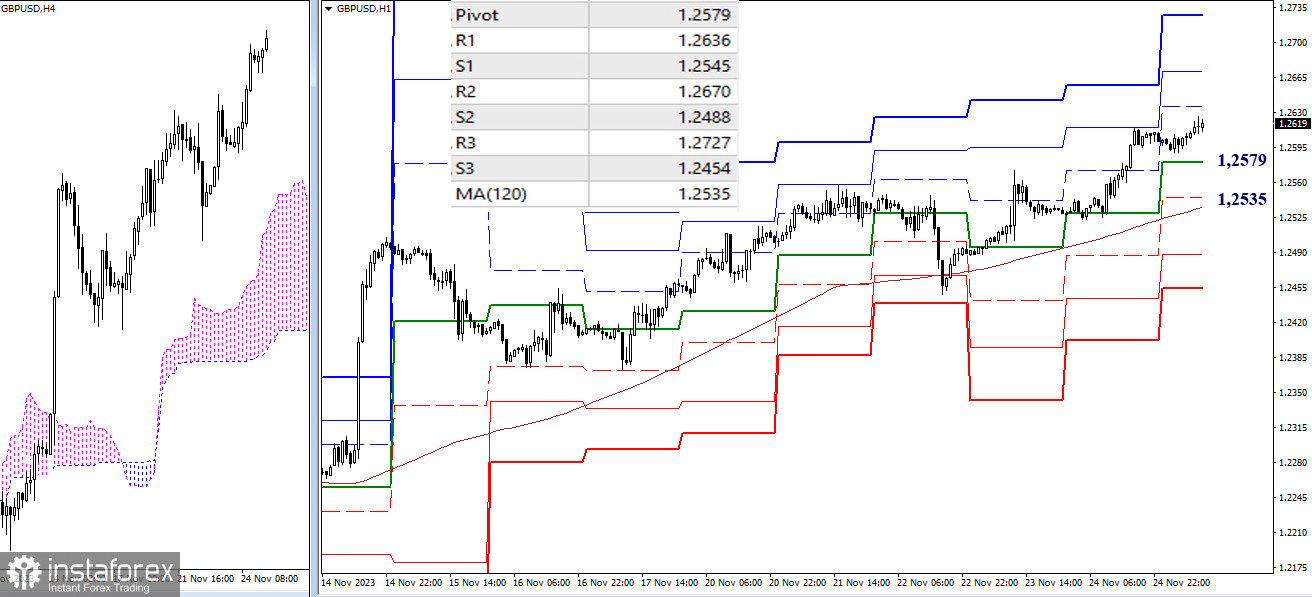
The main advantage now belongs to bullish players. Targets for intraday development today are located at 1.2636 – 1.2670 – 1.2727 (resistances of classic pivot points). The key levels of lower timeframes form a support zone at 1.2579 – 1.2535 (central pivot point of the day + weekly long-term trend). A breakdown, consolidation below, and a reversal of the moving average will change the current balance of power, directing attention to the supports of classic pivot points S2 (1.2488) and S3 (1.2454).
***
The technical analysis of the situation uses:
Higher timeframes - Ichimoku Kinko Hyo (9.26.52) + Fibonacci Kijun levels
Lower timeframes - H1 - Pivot Points (classic) + Moving Average 120 (weekly long-term trend)
 English
 Русский
 Bahasa Indonesia
 Bahasa Malay
 ไทย
ไทย Español
 Deutsch
 Български
 Français
 Tiếng Việt
 中文
中文 বাংলা
বাংলা हिन्दी
 Čeština
 Українська
 Română

