EUR/USD
Analysis:
The ascending wave structure of the euro chart since September 26 continues to gain momentum. The price has reached the lower boundary of a broad potential reversal zone, but the wave structure does not indicate incompleteness. The last segment reports on November 21. Within it, an intermediate correction formed last week. The ascending segment that started last Friday has reversal potential.
Forecast:
The euro's price will move towards the calculated resistance area in the next few days. Short-term pressure on this zone cannot be ruled out, with a possible breakthrough of its upper boundary. A reversal and resumption of the bearish course likely coincides with the release of significant news blocks.
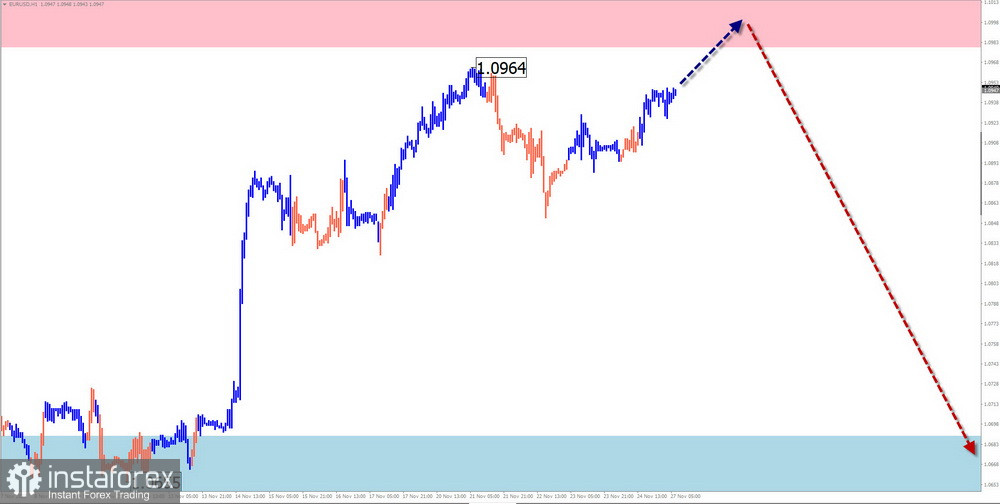
Potential Reversal Zones
Resistance:
- 1.0980/1.1020
Support:
- 1.0690/1.0640
Recommendations:
Sales: can be used after reversal signals appear in the calculated support area in your used trading systems.
Purchases: are quite risky and may result in deposit losses.
USD/JPY
Analysis:
The analysis of the daily scale of the major pair USD/JPY chart shows the completion of an ongoing descending corrective extended plane since early September. The ascending segment potential from November 21 has reversal potential beyond the rollback. The structure includes an unfinished middle part (B).
Forecast:
The beginning of this week is expected to be similar to past periods. A sideways trend and a flat character with a downward vector are expected until the weekend. Towards the end of the week, the likelihood of increased volatility and a resumption of the upward direction increases.
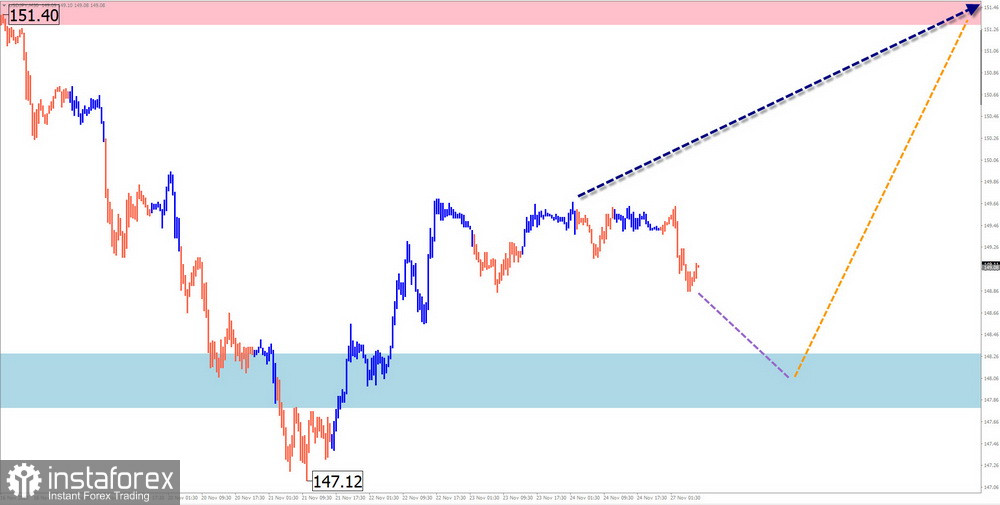
Potential Reversal Zones
Resistance:
- 151.30/151.80
Support:
- 148.30/147.80
Recommendations:
Sales: possible with a small volume during separate sessions. The downside potential is limited to the support zone.
Purchases: These are recommended for trading transactions after receiving confirmed signals from your trading systems in the calculated support area.
GBP/JPY
Analysis:
In the short term, on the GBP/JPY cross chart, the ascending wave algorithm has set the main direction of price movement since July 28. In the last two months, the price has formed a complex correction pattern (B) in a horizontal plane, which does not show completeness during analysis. Last week, quotes broke the upper boundary of a strong resistance zone.
Forecast:
A sideways vector of price movement for the cross is expected at the beginning of the upcoming week. There may be a decline and pressure on the support zone. Closer to the weekend, the probability of a reversal and a resumption of the upward course increases.
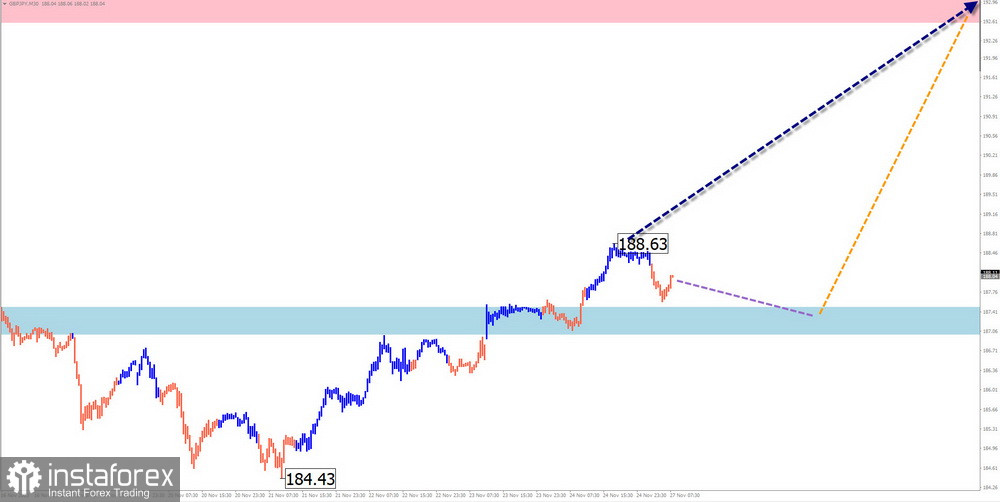
Potential Reversal Zones
Resistance:
- 192.60/193.10
Support:
- 187.50/187.00
Recommendations:
Buys: This will become possible after confirmed reversal signals appear in your trading systems in the support area.
Sells: Can be used with a small lot in separate sessions but carries a high level of risk.
USD/CAD
Analysis:
The price movement direction of the Canadian dollar's main pair has been determined by a bullish trend since July of this year. Since October 5, the price has been corrected. The movement in this wave has a flat character. Extremums on the chart form an extended plane. The structure of this movement is in the final phase.
Forecast:
In the next couple of days, there is a high probability of a continuation of the price decrease. A drift is expected in the calculated support area, with conditions for a reversal. The pair's course growth resumption is likely at the end of the current week or the next. The calculated zones demonstrate the boundaries of the expected weekly pair movement.
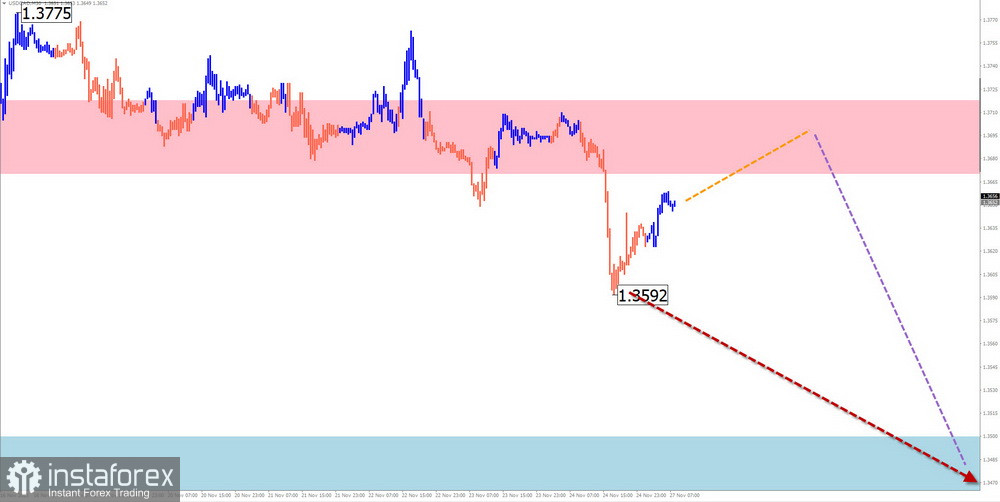
Potential Reversal Zones
Resistance:
- 1.3670/1.3720
Support:
- 1.3500/1.3450
Recommendations:
Buys: Have low potential and can only be used in separate sessions with a fractional lot.
Sells: This will become relevant after the appearance of reversal signals in the calculated resistance area from your used trading systems.
NZD/USD
Brief Analysis:
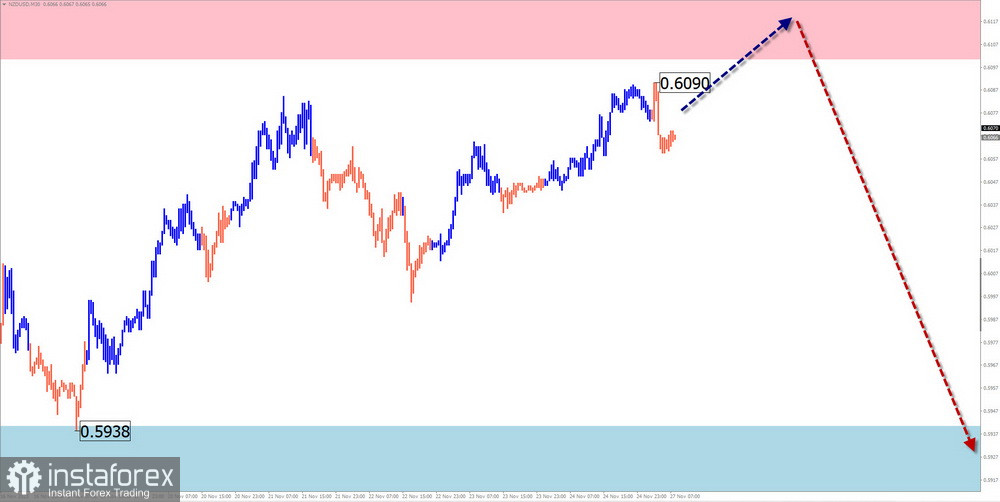
The ascending wave of the New Zealand dollar's major pair dates back to October 26. In the structure of the larger wave, it occupies the place of the last trend segment correction. Quotes are approaching the lower boundary of the powerful, potentially reversal zone of the large TF. There are no signals of an imminent reversal on the chart.
Weekly Forecast:
In the first half of this week, a general sideways trend is expected with an ascending vector. The course growth can be expected to be no higher than the resistance boundaries. Further, there is a high probability of a resumption of the bearish sentiment of price movement. The calculated support demonstrates the lower boundary of the expected weekly pair range.
Potential Reversal Zones
Resistance:
- 0.6100/0.6150
Support:
- 0.5940/0.5890
Recommendations:
Sells: This can be used in trading after the appearance of corresponding indicator signals in your trading systems in the calculated resistance area.
Buys: Possible with a reduced lot in separate sessions. Due to low potential, it is recommended that the trading volume be reduced.
Gold
Analysis:
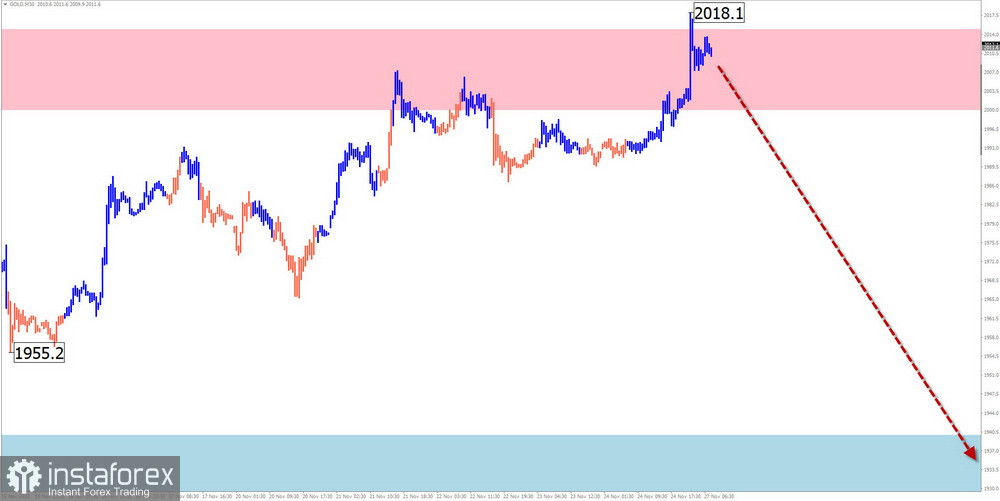
The ascending wave of the gold chart since October 3 continues to set the main direction of the instrument's movement. In the daily TF wave, this segment started the wave's final part (C). Since the end of October, a correction has been forming on a horizontal plane. Its structure still needs to be completed at the time of the analysis. The price moves along the lower boundary of the strong resistance zone.
Forecast:
In the next couple of days, a sideways movement vector will likely be continued. A reversal can be expected in the calculated resistance area. The second half of the week may be more dynamic. A decrease in the price of gold is likely up to the support boundaries.
Potential Reversal Zones
Resistance:
- 2000.0/2015.0
Support:
- 1940.0/1925.0
Recommendations:
Buys: Have limited potential and can be used with a fractional lot in separate sessions.
Sells: After confirmed signals appear in the resistance area, they may be recommended for trading transactions.
Note: In simplified wave analysis (SWA), all waves consist of 3 parts (A-B-C). On each TF, the latest, unfinished wave is analyzed. Dotted lines indicate expected movements.
Attention: The wave algorithm does not consider the duration of instrument movements in time!
 English
 Русский
 Bahasa Indonesia
 Bahasa Malay
 ไทย
ไทย Español
 Deutsch
 Български
 Français
 Tiếng Việt
 中文
中文 বাংলা
বাংলা हिन्दी
 Čeština
 Українська
 Română

