 English
  Русский
 Bahasa Indonesia
 Bahasa Malay
 ไทย
ไทย Español
 Deutsch
 Български
 Français
 Tiếng Việt
 中文
中文 বাংলা
বাংলা हिन्दी
 Čeština
 Українська
 Română

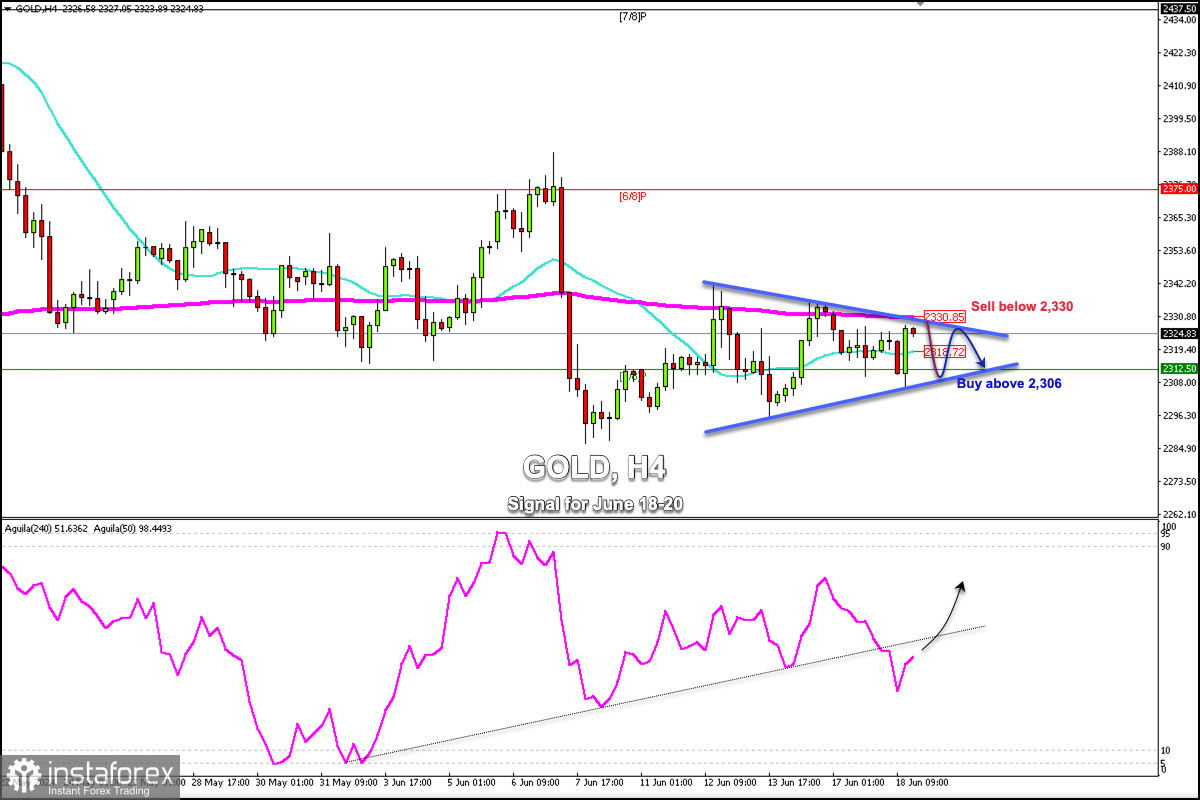
Early in the American session, Gold is trading around 2,324.83 bouncing after having reached a low of around 2,306. The price is now reaching a resistance zone that coincides with the 200 EMA around 2330.
On the H4 chart, we can see that gold is trading within a symmetrical triangle pattern. The metal will likely trade within this pattern in the coming hours and we could expect bearish pressure below 2,330.
In case the XAU/USD trades within the symmetrical triangle pattern and if a technical correction occurs, we could expect a technical bounce of around 2,308 or 2,312. So, we could look for opportunities to buy and sell.
A sharp break of this symmetrical triangle pattern could favor a positive outlook as we see that the eagle indicator is showing a positive signal. Bullish momentum will be confirmed provided that gold consolidates above 2,330 (200 EMA).
On the contrary, a drop and a close below 2,310 on the H4 chart could mean a bearish acceleration. Therefore, gold could fall to the psychological level of 2,300 and even reach the June 7 low of around 2,287.
We must take into account the key levels of 2,330 and 2,312. These levels could offer us some points to sell and buy since gold has been consolidating for almost more than a week. Thus, the odds are there will probably be a sharp break in the coming days.