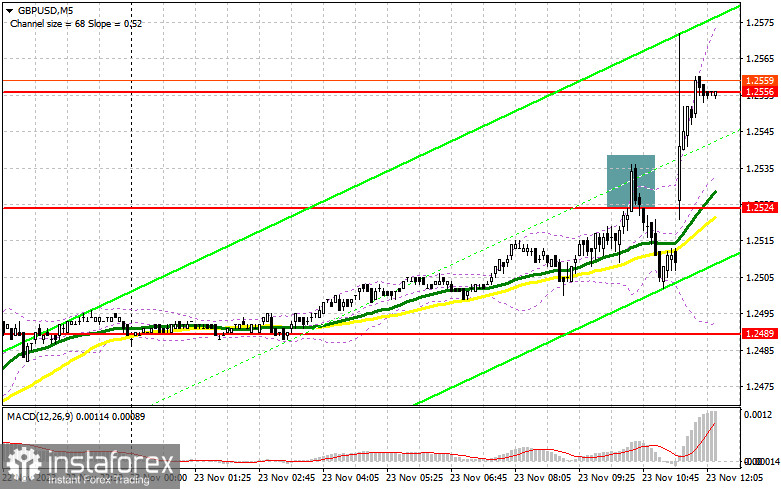
In my morning forecast, I drew attention to the level of 1.2524 and recommended making entry decisions based on it. Let's look at the 5-minute chart and analyze what happened there. The rise and the formation of a false breakout led to a sell signal, resulting in a downward movement of about 20 points. However, a major sell-off did not materialize, as the data from the UK turned out to be positive. The technical picture was revised for the second half of the day.

To open long positions on GBP/USD, the following is required:
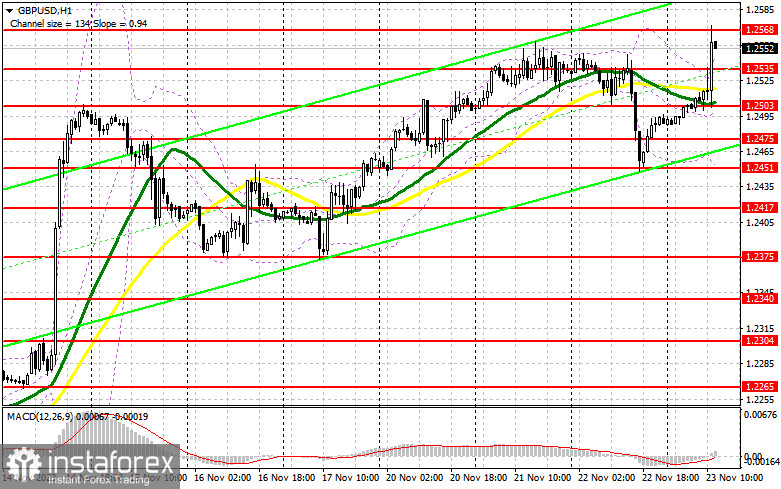
A less active reduction in activity in the UK regarding PMI indices led to a sharp upward surge in the pound and an update of monthly highs. However, demand quickly decreased as we approached the US session, where volatility will be extremely low due to the Thanksgiving Day celebration. In the current conditions, to build up long positions, I prefer to wait for a decline and a false breakout around the new support at 1.2535, formed at the end of the first half of the day. This will give a buy signal and lead to an upward trend to return to this month's maximum of 1.2568. A breakthrough and consolidation above this range will result in a new signal to open long positions with an exit at 1.2604. The ultimate target will be the area of 1.2638, where I will take profit. In the scenario of the pair's decline and the lack of activity from buyers at 1.2535 in the second half of the day, which is more likely, pressure on the pair will increase. In this case, only a false breakout around the next support at 1.2503, where moving averages intersect, will give a signal to open long positions. I plan to buy GBP/USD immediately on the rebound only from 1.2475, with a target of a correction within the day by 30-35 points.
To open short positions on GBP/USD, the following is required:
Sellers did not expect such a turn of events and a strong reaction to the data but took advantage of the moment and showed themselves around the new monthly maximum of 1.2568. Until trading is conducted below this range, the chances of a more significant pound correction in the second half of the day will persist. A false breakout at 1.2568, among other things, will provide a selling entry point to reduce the support at 1.2535, where the main struggle will surely unfold during the US session. A breakthrough and reverse test from the bottom to the top of this range will deal a more serious blow to buyer positions, triggering stop orders and opening the way to 1.2503. The more distant target will be the area of 1.2475, where I will take profit. The upward trend will continue in the scenario of GBP/USD growth and the absence of activity at 1.2568 in the second half of the day. In this case, I will postpone sales until a false breakout at 1.2604. If there is no downward movement, I will sell GBP/USD immediately on the rebound from 1.2638, but only expecting a pair correction down by 30-35 points within the day.


Indicator signals:
Moving Averages
Trading is conducted above the 30 and 50-day moving averages, indicating further pair growth.
Note: The author considers the period and prices of moving averages on the hourly chart H1 and differs from the general definition of classic daily moving averages on the daily chart D1.
Bollinger Bands
In case of a decline, the lower boundary of the indicator, around 1.2503, will act as support.
Description of Indicators:
- Moving Average (50-day, yellow on the chart, determines the current trend by smoothing volatility and noise). Period 50. Marked on the chart in yellow.
- Moving Average (30-day, green on the chart, determines the current trend by smoothing volatility and noise). Period 30. Marked on the chart in green.
- MACD indicator (12, 26, 9).
- Bollinger Bands (20).
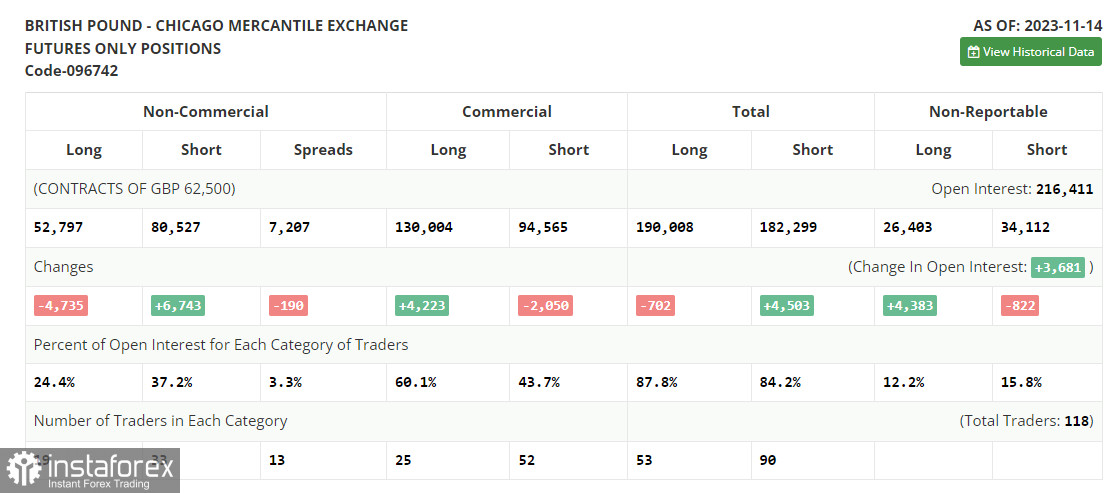
- Non-commercial traders - speculators, such as individual traders, hedge funds, and large institutions using the futures market for speculative purposes and meeting certain requirements.
- Long non-commercial positions represent the total long open position of non-commercial traders.
- Short non-commercial positions represent the total short open positions of non-commercial traders.
- The total non-commercial net position differs between non-commercial long and short positions.
 English
 Русский
 Bahasa Indonesia
 Bahasa Malay
 ไทย
ไทย Español
 Deutsch
 Български
 Français
 Tiếng Việt
 中文
中文 বাংলা
বাংলা हिन्दी
 Čeština
 Українська
 Română

