EUR/USD

Higher Timeframes
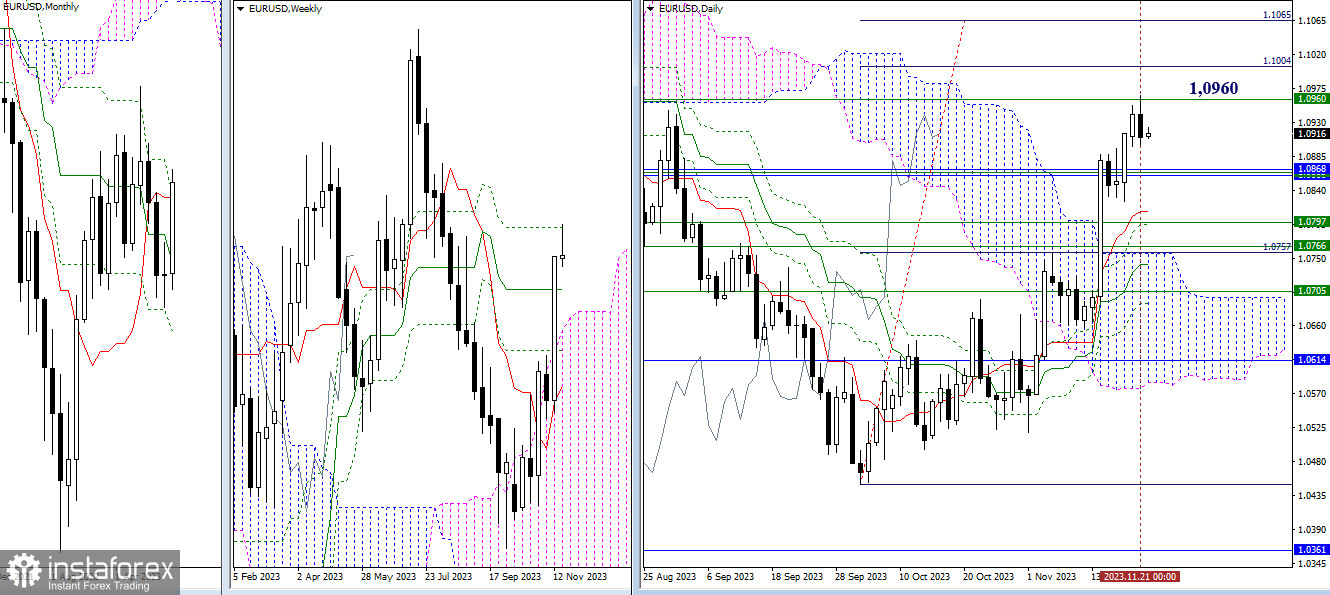
The final resistance of the death cross of the weekly Ichimoku cloud (1.0960) has been tested. As a result, a rebound has formed on the daily timeframe. Upon confirmation and development of the rebound, the market will encounter a cluster of resistances in the range of 1.0862-68 (monthly levels + weekly medium-term trend), then the resistances form a wide zone, combining daily (1.0812 – 1.0795 – 1.0756 – 1.0742 – 1.0689) and weekly (1.0797 – 1.0766 – 1.0705) support levels. However, if the bulls fail to maintain control, breaking through 1.0960 will open the way to the target for breaking through the daily cloud (1.1004 – 1.1065).

H4 – H1
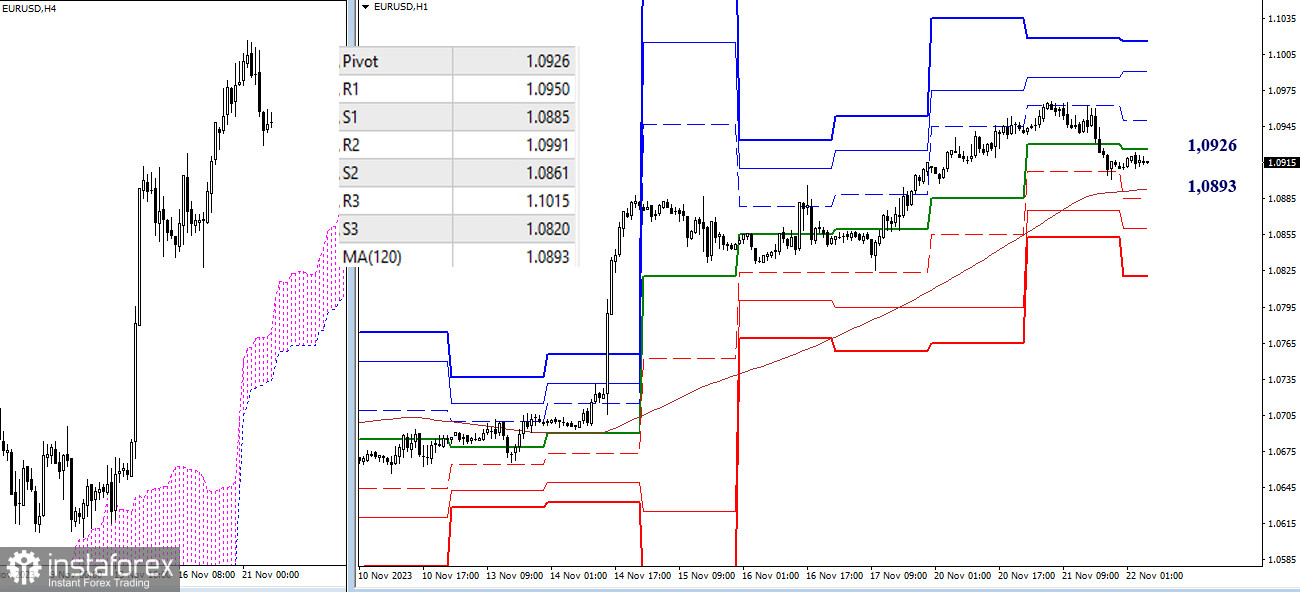
On the lower timeframes, bulls maintain their advantage, but the prolonged current corrective decline has allowed the bears to take control of the central pivot point of the day (1.0926) and approach the weekly long-term trend (1.0893). The last level is responsible for the current balance of power on the lower timeframes, and its breakdown can change the ratio and priorities. Additional reference points of classic pivot points within the day are currently at 1.0885 – 1.0861 – 1.0820 (support) and 1.0950 – 1.0991 – 1.1015 (resistance).
***
GBP/USD

Higher timeframes
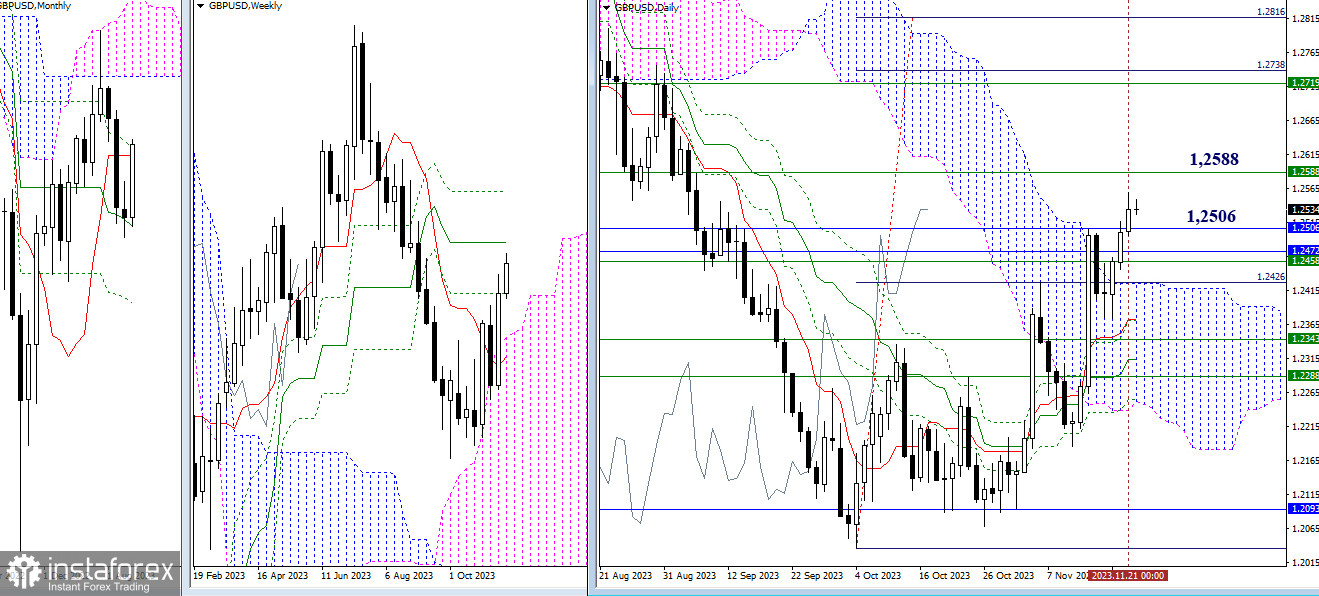
Yesterday, the bulls broke through the monthly resistance (1.2506). The nearest targets for further ascent are the weekly levels (1.2588 – 1.2719) and the daily target for breaking through the Ichimoku cloud (1.2738 – 1.2816). In case of a return of bearish activity to the market, the main task will be to free themselves from the influence of the previously passed cluster of levels of various timeframes (1.2506 – 1.2472 – 1.2458 – 1.2425).

H4 – H1
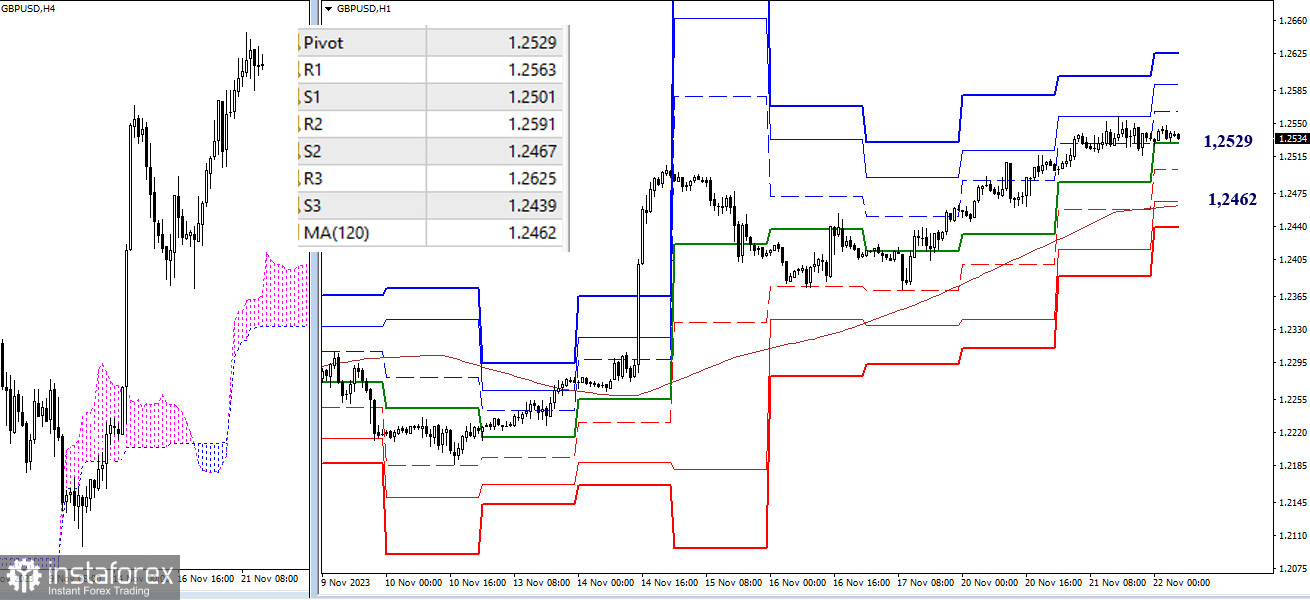
On the lower timeframes, consolidation is currently observed. The market has paused, with the bulls maintaining their advantage. For them, the resistance levels of classic pivot points (1.2563 – 1.2591 – 1.2625) can be the benchmarks within the day today. In case of the development of a decline, attention will be directed to the support levels of classic pivot points (1.2501 – 1.2467 – 1.2439), but breaking through and reversal of the weekly long-term trend (1.2462) will play the most significant role in changing the current balance of power.
***
The technical analysis of the situation uses:
Higher timeframes - Ichimoku Kinko Hyo (9.26.52) + Fibonacci Kijun levels
Lower timeframes - H1 - Pivot Points (classic) + Moving Average 120 (weekly long-term trend)
 English
 Русский
 Bahasa Indonesia
 Bahasa Malay
 ไทย
ไทย Español
 Deutsch
 Български
 Français
 Tiếng Việt
 中文
中文 বাংলা
বাংলা हिन्दी
 Čeština
 Українська
 Română

