GBP/USD:
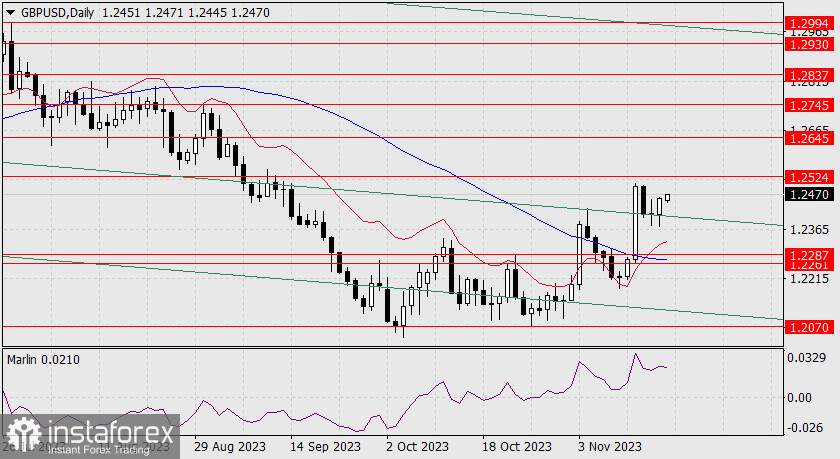
Let's pay attention to the green line of the descending price channel on the daily chart. On Wednesday, November 15th, the daily black candle closed exactly on this line. On Thursday, the day opened and closed on this line, and on Friday, after a false breakout with the lower shadow, the price surged.

Therefore, assuming that a correction will occur from 1.2524 or higher, this price channel line will provide strong support. The Marlin oscillator is rising, and we expect the price to test the nearest level of 1.2524, and it may breach 1.2645.

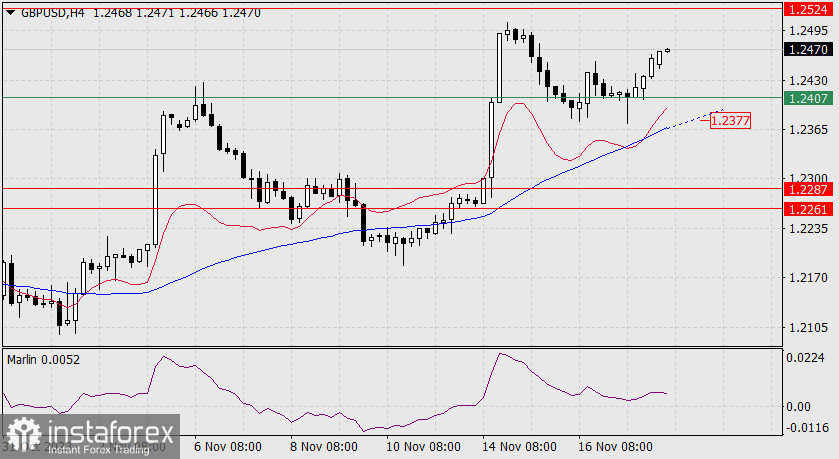
On the 4-hour chart, the price shows accelerated growth from the level of 1.2407 (the price channel line on the daily chart). The Marlin oscillator turned around as it approached the boundary of the downtrend territory. The pair will likely continue its upward movement, and the main target will be 1.2645 after overcoming 1.2524.
 English
 Русский
 Bahasa Indonesia
 Bahasa Malay
 ไทย
ไทย Español
 Deutsch
 Български
 Français
 Tiếng Việt
 中文
中文 বাংলা
বাংলা हिन्दी
 Čeština
 Українська
 Română

