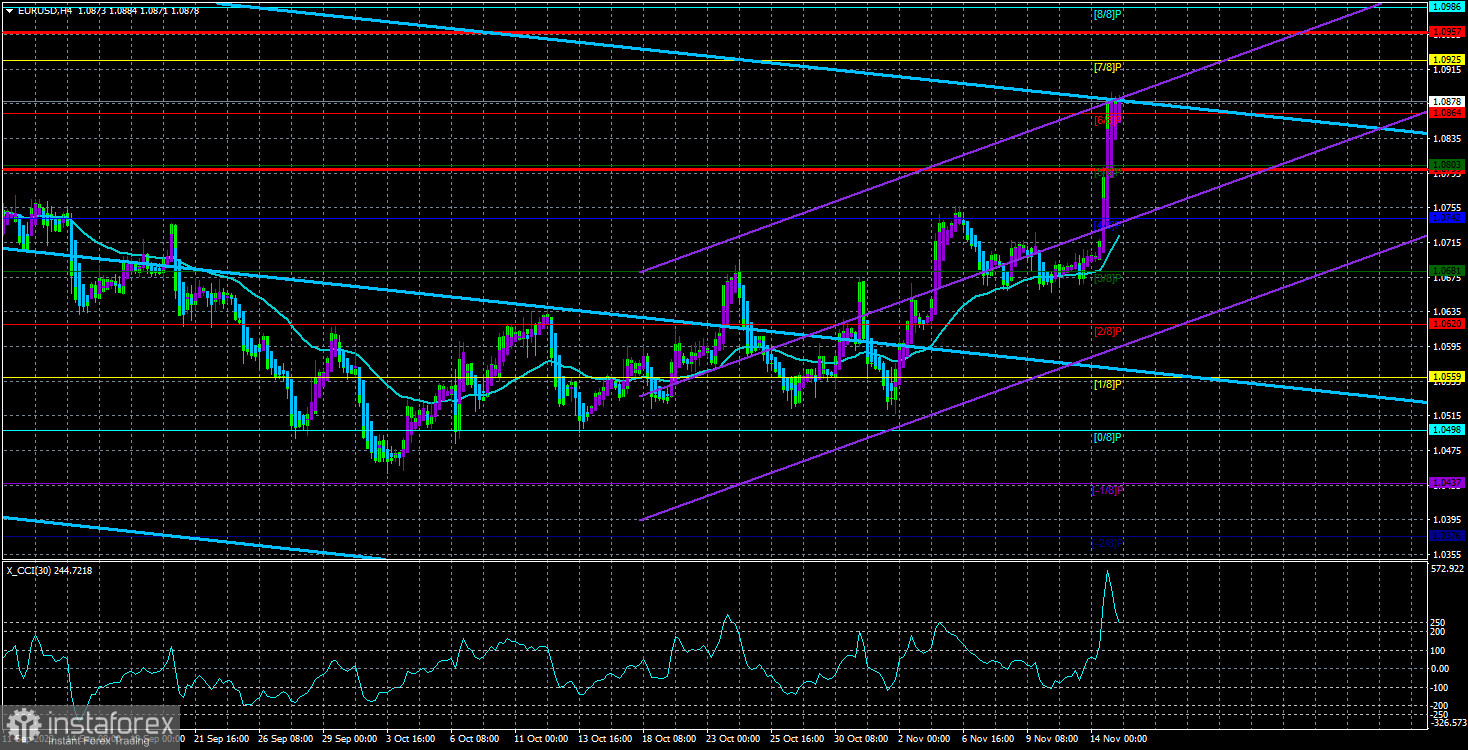
On Tuesday, the EUR/USD currency pair traded as if the Federal Reserve had decided to start the rate-cutting process or inflation had suddenly dropped to 2%. The US dollar fell by 200 points in an instant. Such a market reaction is observed only at some FRS meetings where important decisions are made. So, what caused this catastrophe for the American currency? The inflation report. First, let's recall the market's reaction to previous reports when inflation unexpectedly rose. The maximum was 50–60 points. What was the market's reaction to the last nonfarm payrolls report? A maximum of 100 points. But yesterday, the inflation report for October was released, and its value differed by only 0.1% from the forecasts. This applies to both the core and headline indicators. And what do we see? The collapse of the American currency.
The first obvious conclusion was that the market reacted inadequately and too emotionally. The market did not expect such a sharp slowdown in price growth, so it rushed to get rid of the American currency. After all, the probability of tightening the FRS monetary policy now tends to be zero. But we can draw several interesting conclusions thanks to yesterday's movement.
The second conclusion: the CCI indicator has entered the overbought zone for the third time, and the current upward movement is still a correction. Of course, almost any movements are possible in the foreign exchange market, and signals are only sometimes executed and interpreted correctly. However, from our point of view, signals of overbought conditions in a bearish trend indicate an impending decline. If it weren't for weak Nonfarms at the beginning of the month and yesterday's inflation report, the price would not have been able to surpass the Murray level "3/8"-1.0681. In other words, the price would remain flat or have resumed a downward trend. However, macroeconomic statistics have made adjustments to the technical picture.
The third conclusion: the upward correction is now definitely convincing. If we said that the correction was weak a few weeks ago, so there could be new waves of it, now it is no longer weak. We still believe that the downtrend will resume.
Conclusions on inflation.
In principle, the conclusions that can be drawn from yesterday's inflation report are very simple. Since inflation in the United States is decreasing again, it is obvious that the chances of seeing a new tightening of the FRS monetary policy are now close to zero. Of course, new surges in the consumer price index are possible. Some representatives of the FRS have said that inflation may "jump" up and down in the coming months. However, this is already irrelevant. Even before yesterday's report, the market assessed the probability of additional tightening as low, and after the report, it is practically zero. This is a bearish factor for the dollar, but we want to remind you that the euro also has no grounds for growth.
Why did we see such a strong strengthening of the European currency? Perhaps the ECB began to hint at new tightening? No. The European economy may have started to grow. No. Has macroeconomic statistics from the European Union been pleasing us lately? Also no. Therefore, the euro's rise is the merit of the dollar, which came under pressure due to insignificant reports in the United States. In the future, if the American economy continues to disappoint traders, we may see an even greater rise in the euro within the same correction (after all, the correction can easily reach 100% of the trend). However, we believe there are still no "own" reasons for the euro to grow. Thus, we expect a resumption of the decline. However, strong sell signals on the 4-hour and 24-hour timeframes will now be needed because yesterday's movement seriously spoiled the technical picture on both charts.

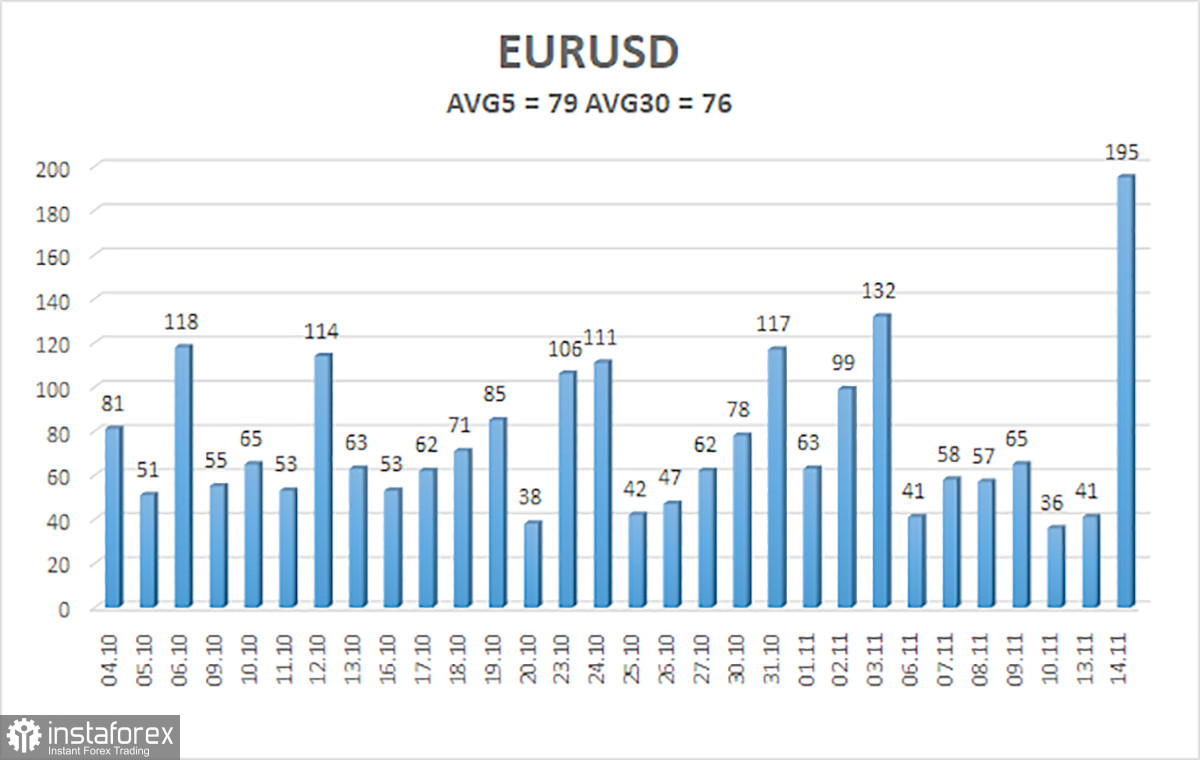
The average volatility of the EUR/USD currency pair over the last five trading days as of November 15 is 79 points and is characterized as "average." Thus, we expect the pair to move between the levels of 1.0799 and 1.0957 on Wednesday. A reversal of the Heiken Ashi indicator will indicate the beginning of a downward correction.
Nearest support levels:
S1 - 1.0864
S2 - 1.0803
S3 - 1.0742
Nearest resistance levels:
R1 - 1.0925
R2 - 1.0986
R3 - 1.1047
Trading recommendations:
The EUR/USD pair continues to change direction almost daily, and yesterday's pair's rise was somewhat accidental. Therefore, at this time, it is not advisable to rely on the moving average. The correction trend persists since the price cannot surpass even the moving average. So, first, we observed the daily overcoming of the moving average line, then - a total flat, then - an inadequate rise. The movements of the pair at this time are as confusing as possible.
Explanations for the illustrations:
Linear regression channels - help determine the current trend. The trend is currently strong if both are directed in the same direction.
Moving average line (settings 20.0, smoothed) - determines the short-term trend and direction in which trading should be conducted now.
Murray levels - target levels for movements and corrections.
Volatility levels (red lines) - the probable price channel in which the pair will spend the next day, based on current volatility indicators.
CCI indicator - its entry into the oversold zone (below -250) or the overbought zone (above +250) means that a trend reversal is approaching in the opposite direction.
 English
 Русский
 Bahasa Indonesia
 Bahasa Malay
 ไทย
ไทย Español
 Deutsch
 Български
 Français
 Tiếng Việt
 中文
中文 বাংলা
বাংলা हिन्दी
 Čeština
 Українська
 Română

