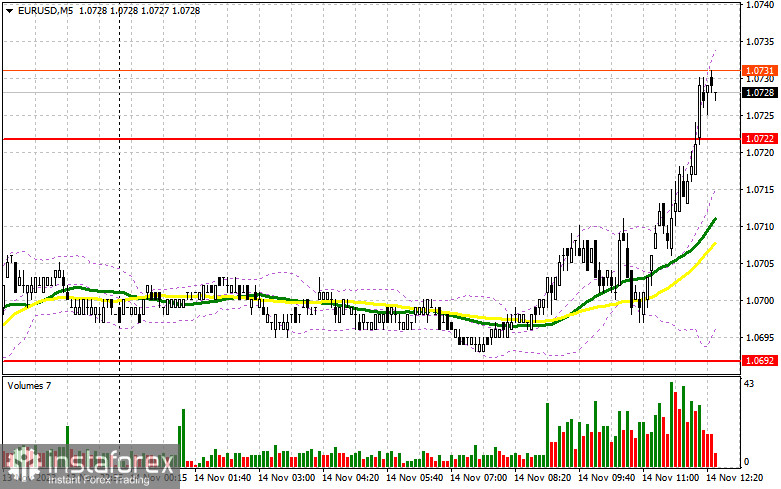
In my morning forecast, I drew attention to the level of 1.0692 and recommended making entry decisions based on it. Let's take a look at the 5-minute chart and analyze what happened. The decline to the area of 1.0692 occurred, but before the formation of a false breakout, it didn't happen, so a suitable entry point into the market was not formed. The technical picture for the second half of the day was only partially revised.

To open long positions on EUR/USD, the following is required:
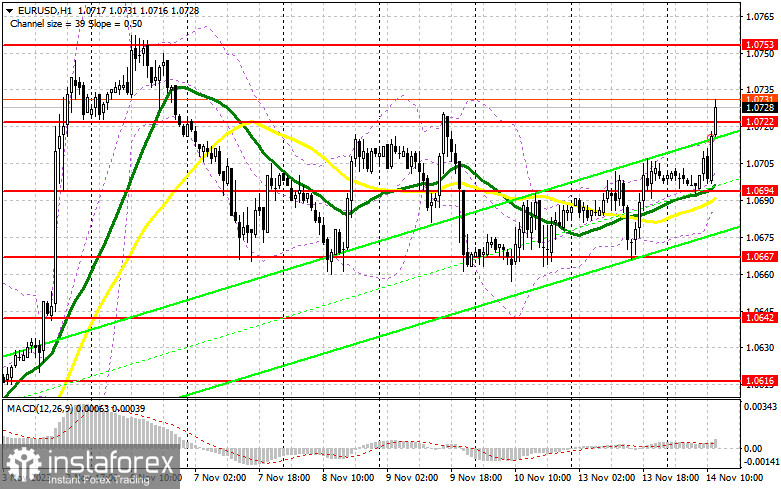
During the European session, quite good data on Germany and the Eurozone and the unchanged GDP report allowed the euro to continue its rise in hopes that US inflation data would be much better than economists' expectations. The US Consumer Price Index is ahead of us, but much more attention will be drawn to the core Consumer Price Index, excluding food and energy prices, which may remain unchanged or show a slower slowdown than expected. If this happens, pressure on the euro will return, and statements by FOMC members Michael S. Barr and Lael Brainard will not help rectify the situation. In the case of a negative market reaction to the data, buyers will have to show themselves around the support area of 1.0694, where the moving averages are playing on their side. Forming a false breakout will provide a good entry point for long positions, expecting further development of the uptrend and another test of resistance at 1.0722, where sellers are currently inactive. Breaking through and updating this range from top to bottom will allow a breakthrough to 1.0753. The ultimate target will be the area of 1.0774, where I will take profits. However, such a significant rise will only occur in the event of a very rapid slowdown in inflationary pressure in the United States. In the case of a decline in EUR/USD and the absence of activity at 1.0694 in the second half of the day, bears can significantly hit buyers' stop orders and take control of the market. This will lead to a larger downward movement to around 1.0667. Only the formation of a false breakout will signal an entry into the market. I will consider opening long positions immediately on a rebound from 1.0642 with a target of an upward correction within the day in the 30-35 point range.
To open short positions on EUR/USD, the following is required:
Sellers continue to experience difficulties. As we can see on the chart, there still needs to be more sellers, even in the area of 1.0722, to turn the market around. Only very high inflation in the United States for October of this year will help. The formation of a false breakout at 1.0722 will signal a sale, counting on a return of pressure on the pair and a move towards support at 1.0694, formed at the end of the first half of the day. Breaking through this level with a subsequent consolidation below will allow for another sell signal with a target of 1.0667. The ultimate target will be a minimum of 1.0642, where I will take profits. In the case of further upward movement of EUR/USD during the American session and the absence of bears at 1.0722, and everything is going in this direction, buyers will try to reach resistance at 1.0753 – the monthly maximum. It is possible to sell there, but only after an unsuccessful consolidation. I will consider opening short positions immediately on a rebound from 1.0774 with a target of a downward correction within the range of 30-35 points.


Indicator signals:
Moving averages:
Trading is above the 30 and 50-day moving averages, indicating an attempt by euro buyers to continue the rise.
Note: The author on the H1 chart determines the period and prices of moving averages, which differs from the general definition of classic daily moving averages on the D1 chart.
Bollinger Bands:
In case of a decline, the lower boundary of the indicator at around 1.0680 will act as support.
Indicator Descriptions:
• Moving Average (MA) is an indicator that determines the current trend by smoothing volatility and noise. Period 50. Marked in yellow on the chart.
• Moving Average (MA) is an indicator that determines the current trend by smoothing volatility and noise. Period 30. Marked in green on the chart.
• Moving Average Convergence/Divergence (MACD) is a trend-following momentum indicator that shows the relationship between two moving averages of a security's price. Fast EMA period 12. Slow EMA period 26. SMA period 9.
• Bollinger Bands - a volatility indicator consisting of a set of lines that form an envelope around the moving average. Period 20.
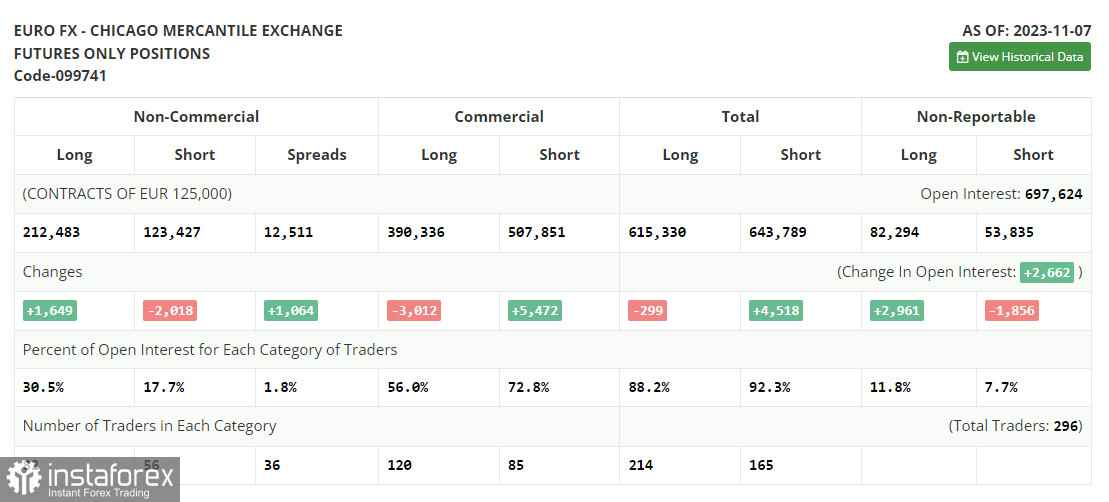
• Non-commercial traders - speculators such as individual traders, hedge funds, and large institutions using the futures market for speculative purposes and meeting certain requirements.
• Long non-commercial positions represent the total long open positions of non-commercial traders.
• Short non-commercial positions represent the total short open positions of non-commercial traders.
• The total non-commercial net position is the difference between short and long positions of non-commercial traders.
 English
 Русский
 Bahasa Indonesia
 Bahasa Malay
 ไทย
ไทย Español
 Deutsch
 Български
 Français
 Tiếng Việt
 中文
中文 বাংলা
বাংলা हिन्दी
 Čeština
 Українська
 Română

