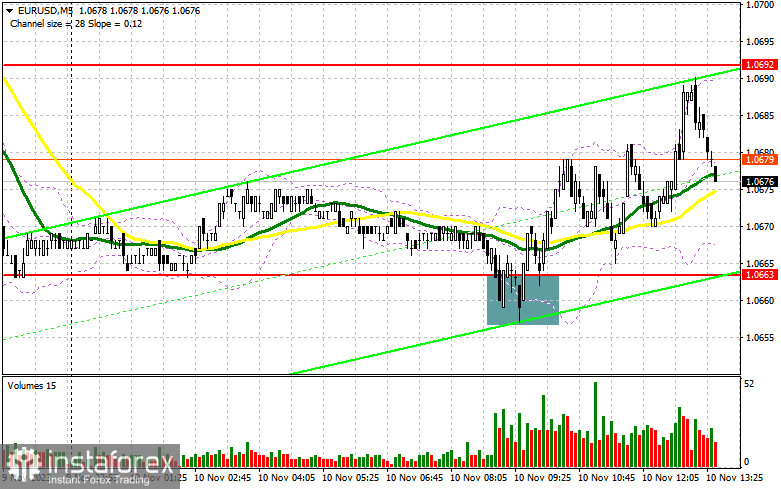
In my morning forecast, I drew attention to the level of 1.0663 and recommended making decisions on market entry based on it. Let's look at the 5-minute chart and analyze what happened there. The decline and the formation of a false breakout around 1.0663 provided an excellent buy signal for the euro, resulting in the pair rising by more than 30 points. Considering that trading is taking place within a sideways channel, the technical picture has not been revised for the second half of the day.

To open long positions on EUR/USD, the following is required:
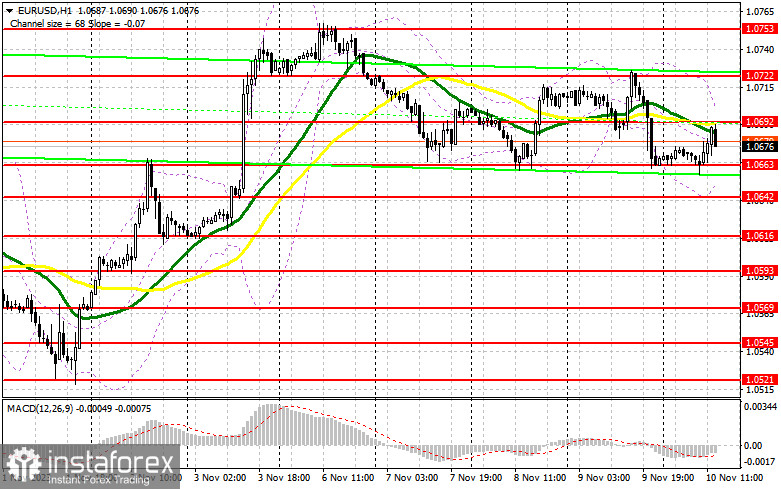
Ahead of us are data on the University of Michigan Consumer Sentiment Index and consumer inflation expectations, which could exert pressure on the pair at any moment, as well as statements from FOMC members Raphael Bostic and Lorie K. Logan, who now have a free hand after Jerome Powell's speech yesterday, clearly indicating that rate hikes are still possible. In the case of a negative market reaction to the speeches, buyers will have to demonstrate strength around the same key support of 1.0663, tested several times this week. Only the development of a false breakout there, similar to what I examined above, will offer a good entry point for long positions, anticipating the emergence of an upward trend and a test of resistance at 1.0692 that had already formed by the end of the previous day. Breaking and updating this range from top to bottom will provide a chance for a leap to 1.0722 and 1.0753. The ultimate target will be the area of 1.0774, where I will make a profit. In the scenario of another decline in EUR/USD and the absence of activity at 1.0663 in the second half of the day, bears can significantly take control of the market at the end of the week, intensifying the downward correction and leading to a larger downward movement to 1.0642. Only the formation of a false breakout will signal an entry into the market. I will open long positions on a rebound from 1.0616 with a target of an upward correction of 30-35 points within the day.
To open short positions on EUR/USD, the following is required:
Sellers continue to attempt to take full control of the market. The euro may react positively to today's US data, provided there is a decrease in consumer inflation expectations. Therefore, active defense of the nearest resistance at 1.0692, where the moving averages are located, is a top priority. The formation of a false breakout at this level will provide a good sell signal, continuing the downward correction towards support at 1.0663. Breaking this level with a subsequent consolidation below will provide another sell signal with an exit to 1.0642. The ultimate target will be the minimum of 1.0616, where I will take a profit. In the event of an upward movement of EUR/USD during the American session and the absence of bears at 1.0692, buyers will return to the market and attempt to reach the resistance at 1.0722. Selling there is possible, but only after an unsuccessful consolidation. I will open short positions immediately on a rebound from the monthly maximum of 1.0753, with a target of a downward correction of 30-35 points.

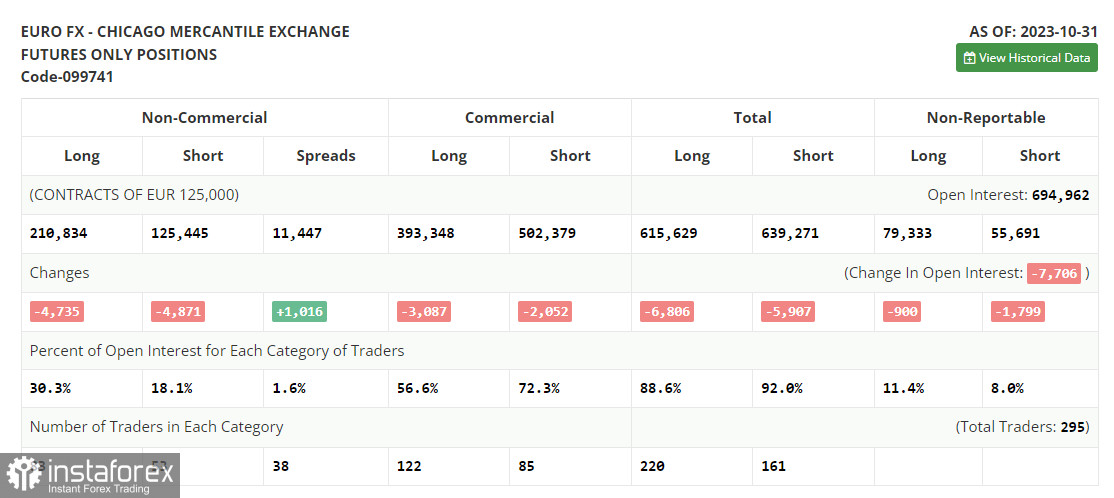
In the COT (Commitment of Traders) report for October 31, there was a reduction in both long and short positions. All of this was positioning ahead of the important meeting of the US Federal Reserve, at which decisions were made to maintain the policy unchanged. However, weak US labor market data, which point to less active job growth, undoubtedly caused a more significant shift in sentiment that is regrettably not yet reflected in this report. Such statistics lately reinforce the idea in investors' minds that the Fed will no longer raise interest rates and that the aggressive policy may end as early as the beginning of next summer. This puts pressure on the US dollar and strengthens risk assets. The COT report indicates that long non-commercial positions decreased by 4,735 to 210,834, while short non-commercial positions decreased by 4,871 to 125,445. As a result, the spread between long and short positions increased by 1,016. The closing price decreased to 1.0603 from 1.0613.

Indicator Signals:
Moving Averages
Trading is conducted below the 30- and 50-day moving averages, indicating the possibility of further euro declines.
Note: The period and prices of moving averages are considered by the author on the hourly chart (H1) and differ from the general definition of classical daily moving averages on the daily chart (D1).
Bollinger Bands
In case of a decline, the lower boundary of the indicator around 1.0690 will act as support.
Indicator Descriptions:
- Moving Average (MA) - 50-day and 30-day moving averages, defining the current trend by smoothing volatility and noise. Periods: 50 (yellow) and 30 (green).
- Moving Average Convergence/Divergence (MACD) - Fast EMA (Exponential Moving Average) period 12, slow EMA period 26, SMA (Simple Moving Average) period 9.
- Bollinger Bands - Period 20.
- Non-commercial traders - speculators such as individual traders, hedge funds, and large institutions using the futures market for speculative purposes and meeting certain requirements.
- Long non-commercial positions represent the total long open position of non-commercial traders.
- Short non-commercial positions represent the total short open position of non-commercial traders.
- The total non-commercial net position is the difference between the short and long positions of non-commercial traders.
 English
 Русский
 Bahasa Indonesia
 Bahasa Malay
 ไทย
ไทย Español
 Deutsch
 Български
 Français
 Tiếng Việt
 中文
中文 বাংলা
বাংলা हिन्दी
 Čeština
 Українська
 Română

