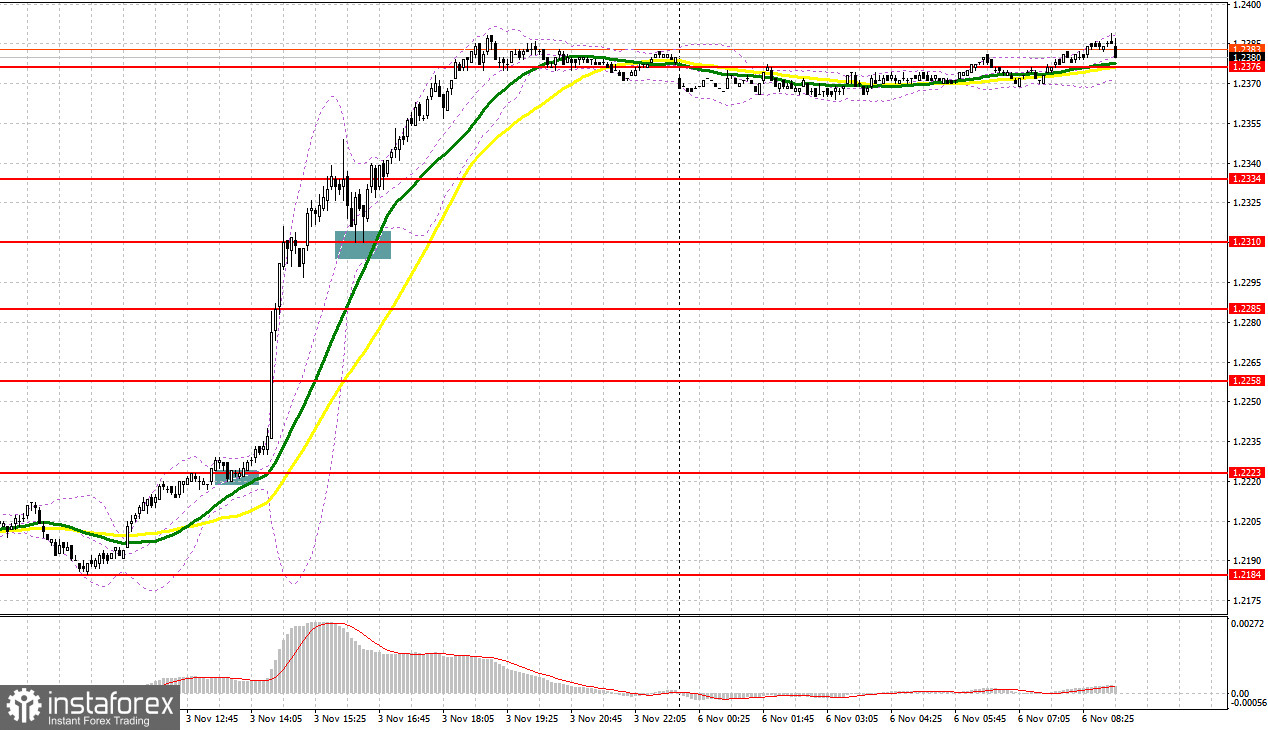
Last Friday, the pair formed several signals to enter the market. Let's have a look at what happened on the 5-minute chart. In my morning review, I mentioned the level of 1.2184 as a possible entry point. A fall to this level and its false breakout generated a good entry point into long positions, sending the price up by more than 30 pips. In the afternoon, a breakout at 1.2223 and its retest formed another buy signal, pushing the pair up by another 90 pips. Then the pair settled firmly above 1.2310 and jumped further by 60 pips.

For long position on GBP/USD:
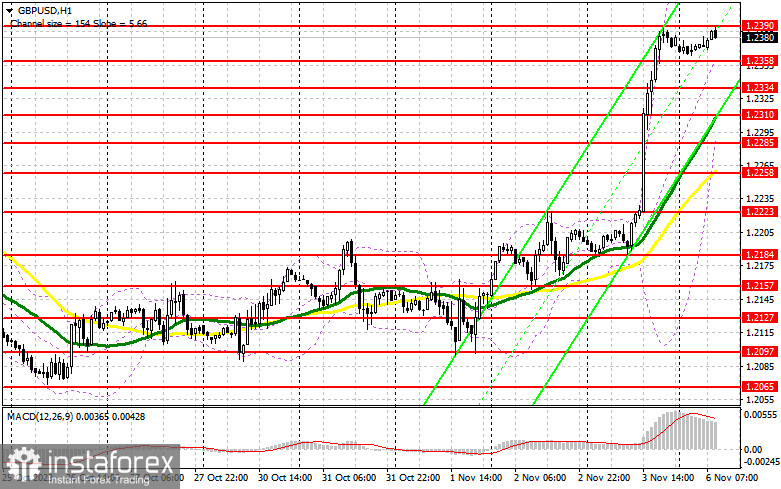
Weak labor jobs from the US spurred a sharp rise in GBP against USD. Today, the pair may continue its upward trajectory following positive figures in the UK's Construction PMI and comments from the Bank of England's Monetary Policy Committee member Hugh Pill. Should there be an adverse reaction, I would consider opening long positions around the 1.2358 mark. A decline and formation of a false breakout there could provide an entry point into long positions, aiming to retest last week's resistance at 1.2390. A breakout and consolidation above this range would enable buyers to strengthen their market stance, signaling a buying opportunity with a target at 1.2425. The ultimate goal will be the 1.2459 area where I intend to lock in profits. If the pair falls and there is no buying activity at 1.2358, only a false breakout at the next support level of 1.2334 would signal the opening of long positions. I plan to buy GBP/USD immediately on a rebound from 1.2310, aiming for an intraday correction of 30-35 pips.
For short positions on GBP/USD:
Sellers have lost control over the market and are unlikely to regain it today. Weak activity data in the services sector and the formation of a false breakout around the nearest resistance of 1.2390, coupled with divergence on the MACD indicator, would be an excellent opportunity for initiating short positions on the pound, anticipating a downward move towards the 1.2358 support. A breakout and an upward retest of this range would deal a more severe blow to buyers' positions, potentially triggering their stop-loss orders and clearing the path to 1.2334. A further target would be the 1.2310 area, where I will take profits. If GBP/USD rises and there is no activity at 1.2390 in the first half of the day, which seems likely, demand for the pound will persist, giving buyers a chance to extend the upward trend. In such a case, I would postpone sales until a false breakout at 1.2425 occurs. Without any downward movement there, I would sell GBP/USD immediately on a rebound from 1.2459, aiming for an intraday correction of 30-35 pips.

COT report
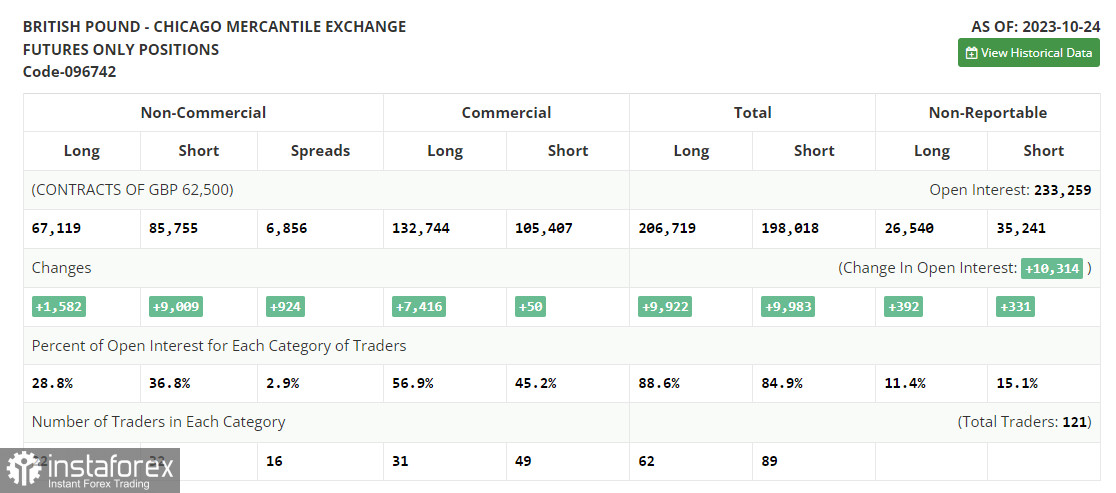
The Commitments of Traders report for October 24 indicated a rise in both long and short positions, tilting favor towards sellers of the GBP/USD pair. UK economic data remains weak, evidenced by reduced activity in both the manufacturing and services sectors, which points to a slowdown in economic growth. At the upcoming meeting this week, the Federal Reserve is likely to leave its monetary policy unchanged, potentially supporting the pound. However, recent strong US data could lead to hints about a possible rate hike in December, thus strengthening the US dollar. Non-commercial long positions went up by 1,582 to 67,119 while non-commercial short positions jumped by 9,009 to 85,755, increasing the spread by 924 positions. The weekly closing price declined to 1.2165 from 1.2179.

Indicator signals:
Moving Averages
Trading above the 30- and 50-day moving averages indicates a further rise in the pair.
Please note that the time period and levels of the moving averages are analyzed only for the H1 chart, which differs from the general definition of the classic daily moving averages on the D1 chart.
Bollinger Bands
If the pair declines, the lower band of the indicator at 1.2285 will act as support.
Description of indicators:
• A moving average of a 50-day period determines the current trend by smoothing volatility and noise; marked in yellow on the chart;
• A moving average of a 30-day period determines the current trend by smoothing volatility and noise; marked in green on the chart;
• MACD Indicator (Moving Average Convergence/Divergence) Fast EMA with a 12-day period; Slow EMA with a 26-day period. SMA with a 9-day period;
• Bollinger Bands: 20-day period;
• Non-commercial traders are speculators such as individual traders, hedge funds, and large institutions who use the futures market for speculative purposes and meet certain requirements;
• Long non-commercial positions represent the total number of long positions opened by non-commercial traders;
• Short non-commercial positions represent the total number of short positions opened by non-commercial traders;
• The non-commercial net position is the difference between short and long positions of non-commercial traders.
 English
 Русский
 Bahasa Indonesia
 Bahasa Malay
 ไทย
ไทย Español
 Deutsch
 Български
 Français
 Tiếng Việt
 中文
中文 বাংলা
বাংলা हिन्दी
 Čeština
 Українська
 Română

