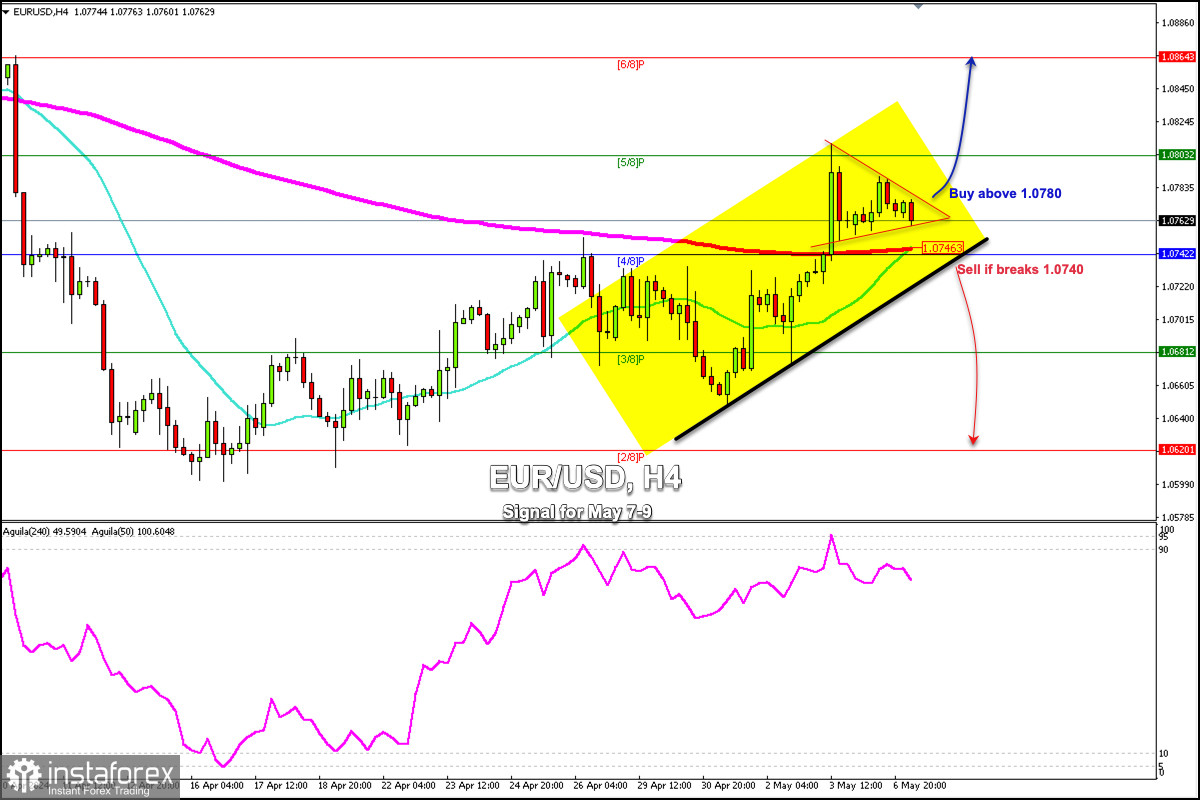
Early in the European session, the EUR/USD pair is trading around 1.0762, showing signs of exhaustion and going through a technical correction below 5/8 Murray (1.0803).
On the H4 chart, we can see that the euro is forming a symmetrical triangle pattern. We believe that if a break occurs above 1.0880, the euro could resume its bullish cycle and reach 1.0803 and at 6/8 Murray located at 1.0864.
On the other hand, in case the euro breaks sharply below 4/8 Murray and consolidates below the 200 EMA, we could look for opportunities to sell, with the target at 2/8 Murray located at 1.0682.
The euro could continue trading within the uptrend channel in the coming days only if it consolidates above the 200 EMA, 21 SMA, and above 4/8 Murray.
If the pair manages to bounce above this area, it will be seen as an opportunity to buy. On the contrary, with a fall below these two moving averages, we could expect a change in the trend.
Since April 24, the eagle indicator has been showing overbought signals but the euro is determined to continue rising. However, every time the price reaches resistance, the euro makes a technical correction and rises again. If this scenario occurs, we could look for opportunities to buy above 1.0740.
 English
 Русский
 Bahasa Indonesia
 Bahasa Malay
 ไทย
ไทย Español
 Deutsch
 Български
 Français
 Tiếng Việt
 中文
中文 বাংলা
বাংলা हिन्दी
 Čeština
 Українська
 Română

