EUR/USD
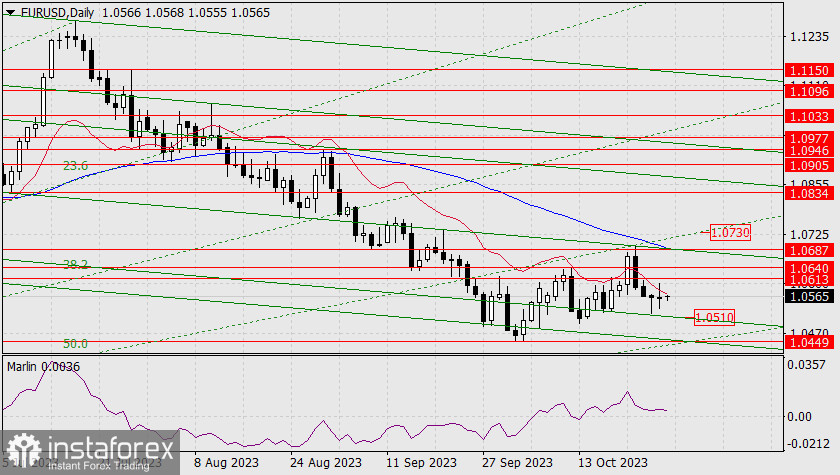
Today, we are making slight adjustments to the technical patterns on the daily chart, and the updated picture shows that the price is heading towards a magnetic point formed by the intersections of the price level 1.0449 (October 3rd low), the price channel line (green), and the Fibonacci ray (dashed line). The conclusion here is that if the price settles below the level of 1.0449, then the medium-term decline will resume. However, if the price rises above the upper Fibonacci ray (1.0730), a new medium-term uptrend will come into play.

The intermediate support level on the way to 1.0449 is the price channel line around the 1.0510 mark. The resistance levels for the bulls are 1.0613, 1.0640, and 1.0687. The latter being the strongest.
On the daily chart, the Marlin oscillator is in the bullish territory, which supports the euro's hidden desire to develop an upward movement. The situation will be resolved on Wednesday once the Federal Reserve announces its policy decision.

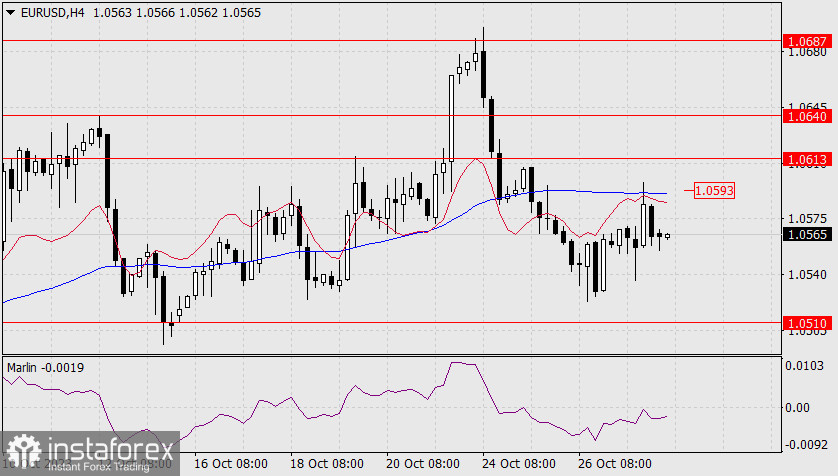
On the 4-hour chart, a downtrend predominates as the price is below the balance and MACD indicator lines, and the Marlin oscillator is in bearish territory. However, the price's proximity to the MACD line and the oscillator's clear intention to move into the bullish territory suggest how unstable the downtrend is. The first sign of a breakdown in the downtrend is when the price climbs above the MACD line (above 1.0593). Any form of decline before breaching the critical level of 1.0449 will most likely be a false move.
 English
 Русский
 Bahasa Indonesia
 Bahasa Malay
 ไทย
ไทย Español
 Deutsch
 Български
 Français
 Tiếng Việt
 中文
中文 বাংলা
বাংলা हिन्दी
 Čeština
 Українська
 Română

