During today's Asian trading session, the Australian dollar strengthened significantly, and the AUD/USD pair rose after the publication of positive macroeconomic data from Australia. Today's release of the Australian Producer Price Index accelerated in the third quarter, from +0.5% to +1.8%, although it slowed slightly on an annual basis, from +3.9% to +3.8%.
On Thursday, Reserve Bank of Australia Governor Michele Bullock stated that the Consumer Price Index had been slightly above expectations but roughly where they had expected it to be. She also mentioned that inflation in the services sector was higher than the level that satisfied them and that the RBA had always had a low tolerance for inflation.
Now, economists expect that the RBA will raise interest rates at the meeting on November 7.

At the same time, the Australian dollar has been strengthening in recent days in major currency pairs, indicating its current strength.
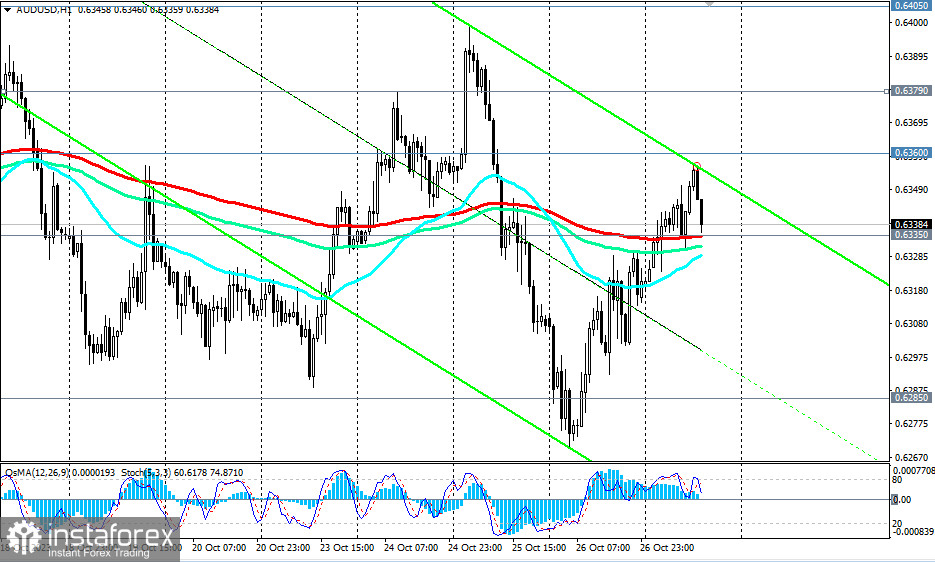
During today's Asian trading session, AUD/USD broke through the important short-term resistance level of 0.6335 (200 EMA on the 1-hour chart).
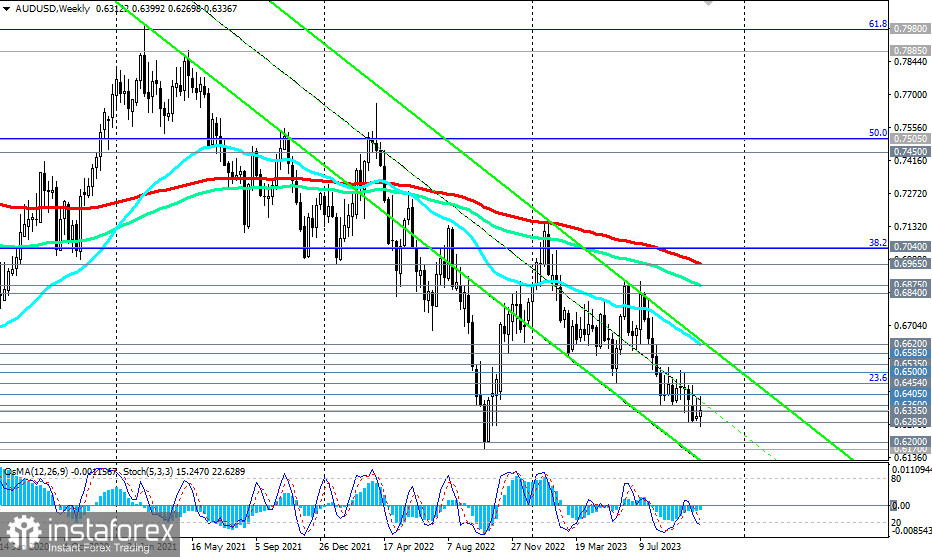
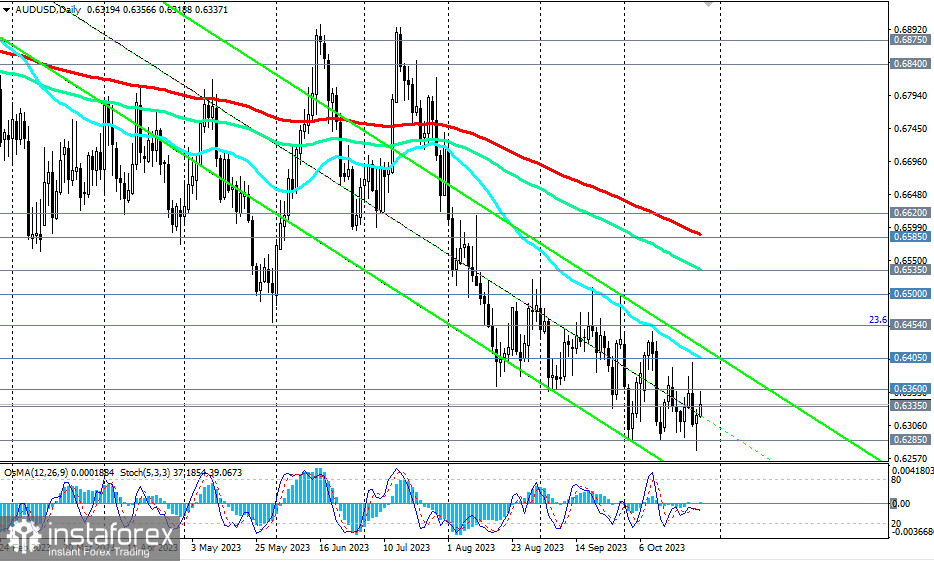
To accelerate and develop the upward correction, the price needs to overcome two more important resistance levels: 0.6379 (200 EMA on the 4-hour chart) and 0.6405 (50 EMA on the daily chart). The targets for further growth are the resistance levels at 0.6454 (23.6% Fibonacci level of the correction wave from 0.9500 to 0.5510), 0.6500, and 0.6535 (144 EMA on the daily chart). Breaking through the resistance levels of 0.6585 (200 EMA on the daily chart) and 0.6620 (50 EMA on the weekly chart) will bring AUD/USD into the medium-term bullish market zone.

However, for now, AUD/USD remains in the medium and long-term bearish trend zone, below the key resistance levels of 0.6965 (200 EMA on the weekly chart) and 0.6585 (200 EMA on the daily chart).
A break below the important short-term support level at 0.6335 (200 EMA on the 1-hour chart) and today's low at 0.6318 may signal a resumption of short positions on AUD/USD, with the nearest target at the local support level of 0.6285. In case of further decline, the pair will move inside the downward channel on the weekly chart towards its lower boundary and levels of 0.6200 and 0.6170 (lows of 2022).
In any case, short positions remain preferable for now. Only a breakout of the key resistance levels of 0.6965 (200 EMA on the weekly chart) and 0.7040 (38.2% Fibonacci level) will bring AUD/USD into the long-term bullish market zone.
Support levels: 0.6335, 0.6300, 0.6285, 0.6200, 0.6170
Resistance levels: 0.6360, 0.6379, 0.6405, 0.6454, 0.6500, 0.6535, 0.6585, 0.6600, 0.6620, 0.6700, 0.6800, 0.6840, 0.6880, 0.6900, 0.6965, 0.7000, 0.7040
 English
 Русский
 Bahasa Indonesia
 Bahasa Malay
 ไทย
ไทย Español
 Deutsch
 Български
 Français
 Tiếng Việt
 中文
中文 বাংলা
বাংলা हिन्दी
 Čeština
 Українська
 Română

