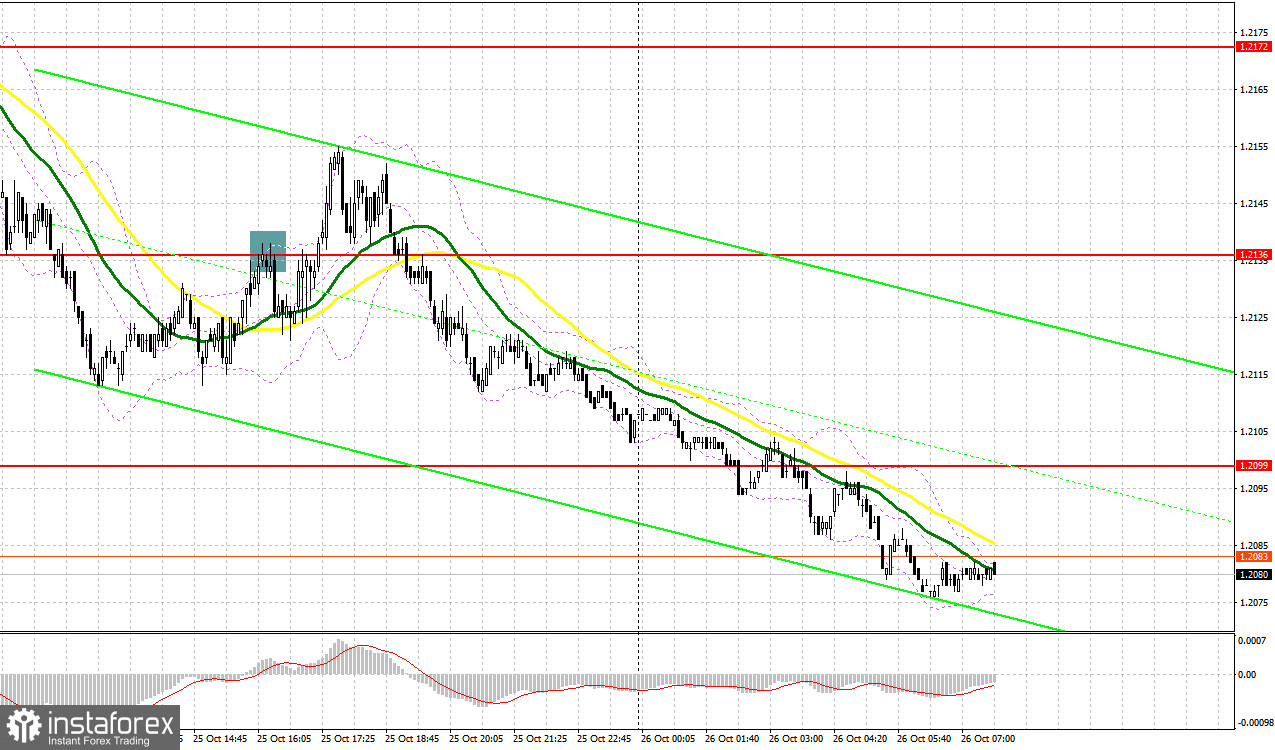
Yesterday, the pair formed only one entry signal. Let's have a look at what happened on the 5-minute chart. In my morning review, I mentioned the level of 1.2154 as a possible entry point. The price broke through this level but failed to retest it, missing just a few pips. That is why I couldn't open short positions in the first half of the day. In the afternoon, a false breakout at 1.2136 generated a sell signal but after a drop of 15 pips, the buying activity on the pound resumed.

For long position on GBP/USD:
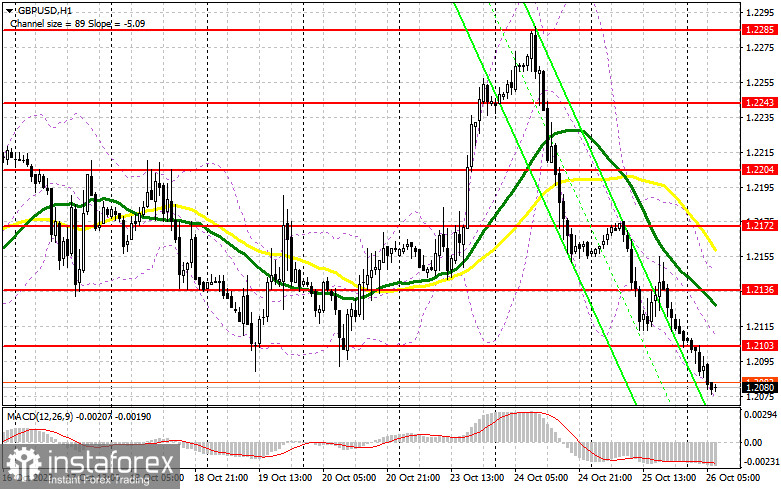
Yesterday's US data kept the British pound under pressure, leading to a stronger US dollar. The story might repeat today as there is no particularly significant data from the UK, and the retail sales report from the Confederation of British Industry is unlikely to alter the market's direction. US statistics, which we will discuss in more detail in our afternoon review, might be the differentiating factor. Thus, I expect the pressure on the GBP/USD pair to continue during the European session, aiming for the monthly low. I will act only after a false breakout around the immediate support of 1.2070 that the price is going to test soon. The target will be the 1.2103 resistance level from yesterday. A breakout and consolidation above this range will allow buyers to re-enter the market and initiate long positions, aiming to retest 1.2136 where the moving averages favor the sellers. The ultimate target is found at 1.2172 where I will be taking profits. In a bearish scenario without any activity from buyers at 1.2070, only a false breakout around the monthly low of 1.2038 will signal the opportunity to open long positions. I plan to buy GBP/USD immediately on a rebound from a low of 1.2012 with a daily correction target of 30-35 pips.
For short positions on GBP/USD:
Bears did well yesterday, and today, they will try to retest the monthly low. To maintain market control, sellers need to hold at the nearest resistance of 1.2103 that was formed yesterday. Only a false breakout at this level will serve as a sell signal capable of driving the pair down to the 1.2070 support. A breakout and a bottom-up retest of this range will deal a significant blow to bullish positions, while weak UK data could pave the way to 1.2038, the monthly low where I anticipate strong buying activity. The next target will be around 1.2012 where I intend to take profits. In the event of a GBP/USD rally with no activity at 1.2103 in the morning session, demand for the pound will return, and buyers might have a chance for a minor bullish correction. In such a scenario, I will delay my selling until a false breakout occurs at 1.2136. If there is no downward movement there, I will sell GBP/USD immediately on a rebound from 1.2172, but only considering a daily correction of 30-35 pips.

COT report
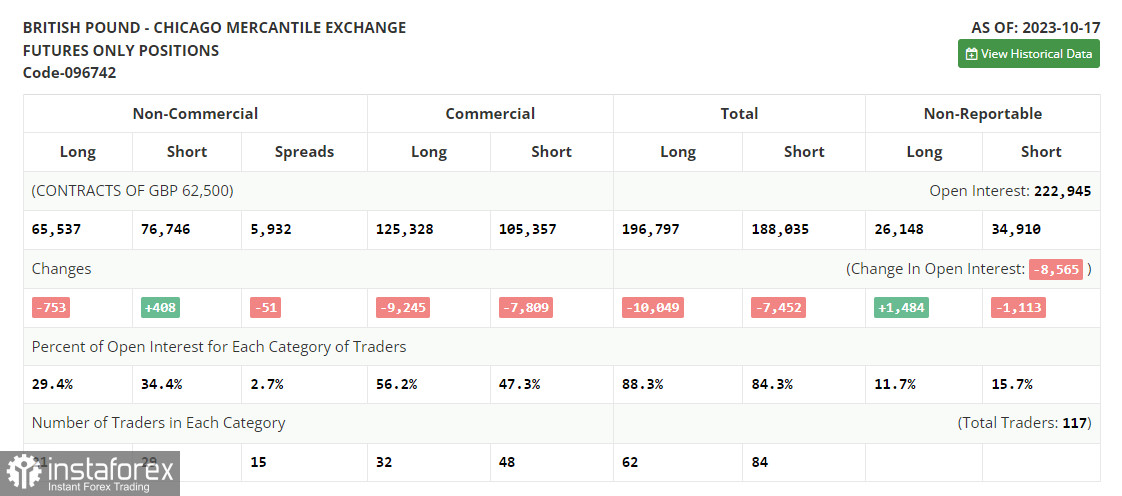
The Commitments of Traders report for October 17 indicated a reduction in long positions and a slight increase in short ones. However, this did not significantly influence the market balance. Amid the UK inflation data signaling continuous growth and US policymakers assuring markets that there would be no more rate hikes in the near future, the US dollar eased while the pound took advantage of it. Apparently, the risk-on sentiment will continue to strengthen at least until the November meeting of the Federal Open Market Committee. The latest COT report indicates that non-commercial long positions decreased by 753 to 65,537, while non-commercial short positions went up by 408 to 76,746. As a result, the spread between long and short positions narrowed by 51. The weekly closing price dropped to 1.2179 from 1.2284.

Indicator signals:
Moving Averages
Trading below the 30- and 50-day moving averages indicates a further decline in the pair.
Please note that the time period and levels of the moving averages are analyzed only for the H1 chart, which differs from the general definition of the classic daily moving averages on the D1 chart.
Bollinger Bands
If the pair declines, the lower band of the indicator at 1.2065 will act as support.
Description of indicators:
• A moving average of a 50-day period determines the current trend by smoothing volatility and noise; marked in yellow on the chart;
• A moving average of a 30-day period determines the current trend by smoothing volatility and noise; marked in green on the chart;
• MACD Indicator (Moving Average Convergence/Divergence) Fast EMA with a 12-day period; Slow EMA with a 26-day period. SMA with a 9-day period;
• Bollinger Bands: 20-day period;
• Non-commercial traders are speculators such as individual traders, hedge funds, and large institutions who use the futures market for speculative purposes and meet certain requirements;
• Long non-commercial positions represent the total number of long positions opened by non-commercial traders;
• Short non-commercial positions represent the total number of short positions opened by non-commercial traders;
• The non-commercial net position is the difference between short and long positions of non-commercial traders.
 English
 Русский
 Bahasa Indonesia
 Bahasa Malay
 ไทย
ไทย Español
 Deutsch
 Български
 Français
 Tiếng Việt
 中文
中文 বাংলা
বাংলা हिन्दी
 Čeština
 Українська
 Română

