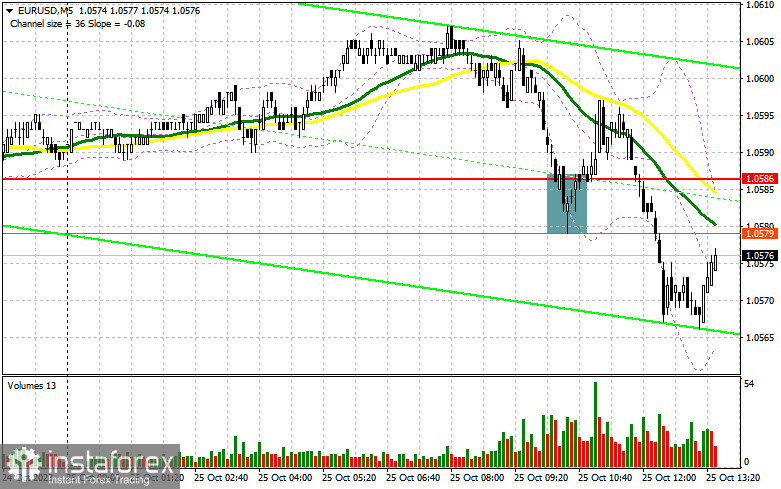
In my morning forecast, I drew attention to the level of 1.0586 and recommended using it to make trading decisions. Let's look at the 5-minute chart and analyze what happened there. The decline and the formation of a false breakout around 1.0586 occurred, which gave a signal to buy. However, despite good statistics, there was no significant upward movement, and after that, the bulls missed the 1.0586 level. For the second half of the day, the technical picture was completely revised.

To open long positions on EUR/USD, the following is required:
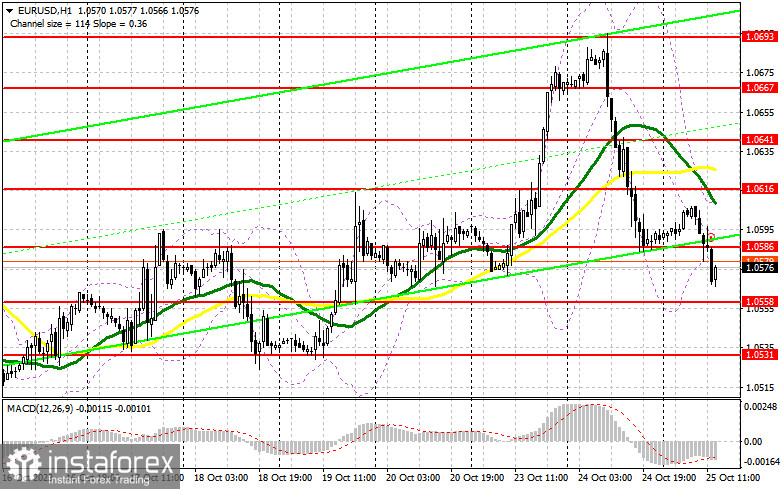
Good reports from the IFO on Germany were only able to temporarily halt the bearish market for the euro but not reverse it. In the second half of the day, there isn't much US data, but special attention will be drawn to the report on the volume of sales of new homes and the speech of the Fed's Board of Governors Chairman, Jerome Powell. Powell is unlikely to say anything about monetary policy, so there is no expectation of a sharp drop in demand for the dollar. In the case of a further decline in EUR/USD, only a false breakout formation around the 1.0558 support level, which we didn't reach in the first half of the day, will provide a signal for entering long positions with the target of a rebound towards the 1.0586 resistance level. Only a breakout and top-down retesting of this range after disappointing US data will revive demand for EUR/USD, providing an opportunity to halt the bearish market and have a minor upward correction with a jump to 1.0616. The ultimate target will be the 1.0641 area, where I would take a profit. In the case of EUR/USD's decline and the absence of activity at 1.0558 in the second half of the day, the bears will strengthen control over the market. In this case, only a false breakout formation around 1.0531 would signal buying euros. I would consider opening long positions on the rebound from 1.0497 with the target of an intraday upward correction of 30-35 points.
To open short positions on EUR/USD, the following is required:
Sellers continue to assert themselves and now aim for consolidation near the weekly low. In the event of weak US data and a spike in the euro in the second half of the day, protecting 1.0586 will be a top priority. A false breakout formation will signal a sell-off with a move down to the new support level of 1.0558. We can only start talking about the formation of a new bearish trend after a breakout and consolidation below this range, along with a reverse test from bottom to top, which will signal a sell-off with a move to 1.0531. The ultimate target will be the minimum of 1.0497, where I would take a profit. In the event of upward movement in EUR/USD during the American session and the absence of bears at 1.0586, buyers will have a chance for a correction. In this scenario, I would postpone short positions until the 1.0616 resistance level, where the moving averages are favoring sellers. Selling is possible, but only after an unsuccessful consolidation. I would open short positions immediately on the rebound from 1.0641, with the target of a downward correction of 30-35 points.

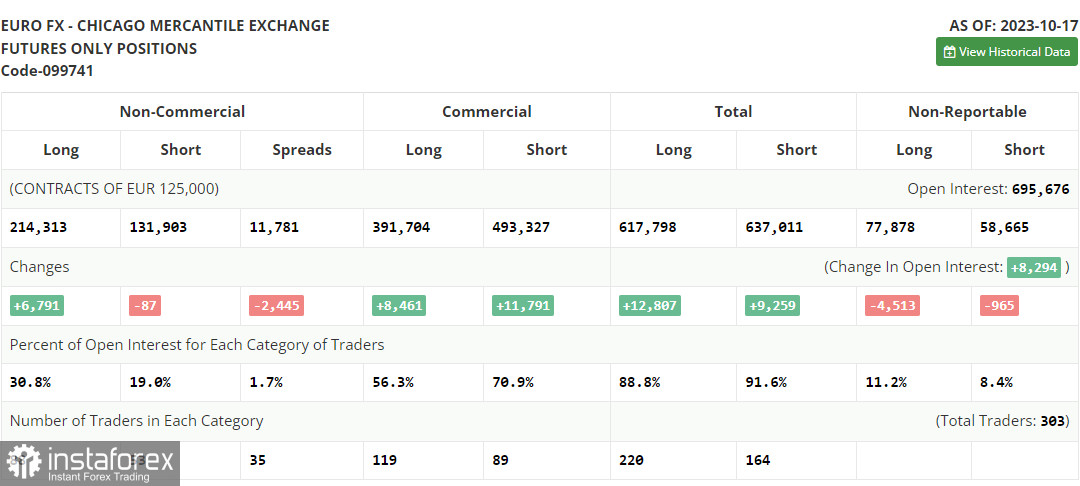
In the COT report (Commitment of Traders) for October 17, there was an increase in long positions and a minimal decrease in short positions. Strong economic indicators continued to emerge in the United States, including those related to retail sales and the labor market, signaling the need for further interest rate hikes. However, before the typical silence that Federal Reserve representatives usually observe prior to a committee meeting, statements from policymakers allowed us to conclude that no one would raise interest rates during the November meeting. This weakened the demand for the dollar and restored confidence among European currency buyers. Apparently, this trend will persist in the near future. The COT report indicated that long non-commercial positions increased by 6,791 to reach 214,313, while short non-commercial positions only decreased by 87 to 131,903. As a result, the spread between long and short positions decreased by 2,445. The closing price dropped to 1.0596 from 1.0630, confirming a bullish correction for the euro.

Indicator Signals:
Moving Averages:
Trading is conducted below the 30 and 50-day moving averages, indicating the possibility of a further decline in the euro.
Note: The period and prices of the moving averages mentioned by the author are considered on the hourly chart (H1) and differ from the general definition of classical daily moving averages on the daily chart (D1).
Bollinger Bands
In the case of a decrease, the lower boundary of the indicator at around 1.0585 will act as support.
Description of indicators:
- Moving average (determines the current trend by smoothing out volatility and noise). Period 50. Marked on the chart in yellow.
- Moving average (determines the current trend by smoothing out volatility and noise). Period 30. Marked on the chart in green.
- MACD Indicator (Moving Average Convergence/Divergence) - Fast EMA Period 12, Slow EMA Period 26, SMA Period 9.
- Bollinger Bands - Period 20.
- Non-commercial traders - speculators such as individual traders, hedge funds, and large institutions using the futures market for speculative purposes and meeting certain requirements.
- Long non-commercial positions represent the total long open positions of non-commercial traders.
- Short non-commercial positions represent the total short open positions of non-commercial traders.
- The total non-commercial net position is the difference between the short and long positions of non-commercial traders.
 English
 Русский
 Bahasa Indonesia
 Bahasa Malay
 ไทย
ไทย Español
 Deutsch
 Български
 Français
 Tiếng Việt
 中文
中文 বাংলা
বাংলা हिन्दी
 Čeština
 Українська
 Română

