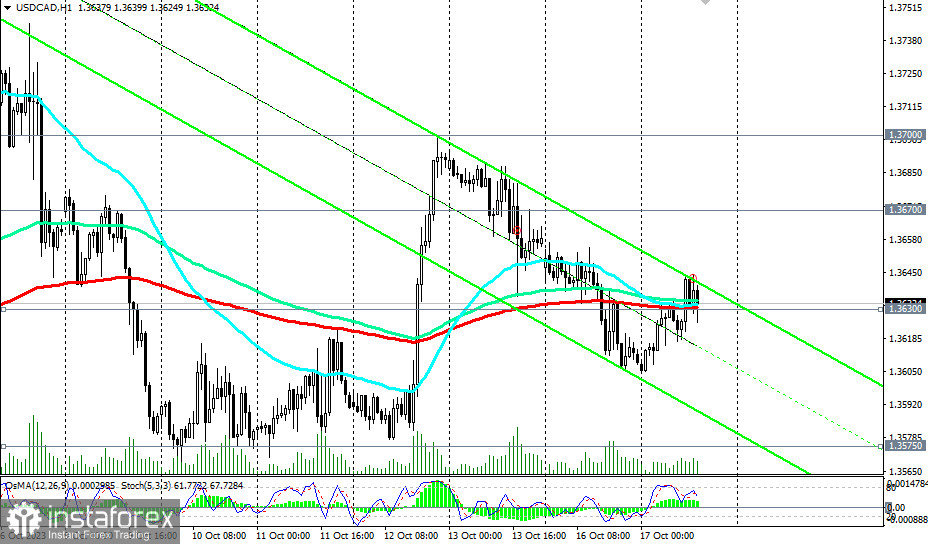
As of writing, USD/CAD was trading near the level of 1.3630, practically at a significant short-term support level (200 EMA on the 1-hour chart).
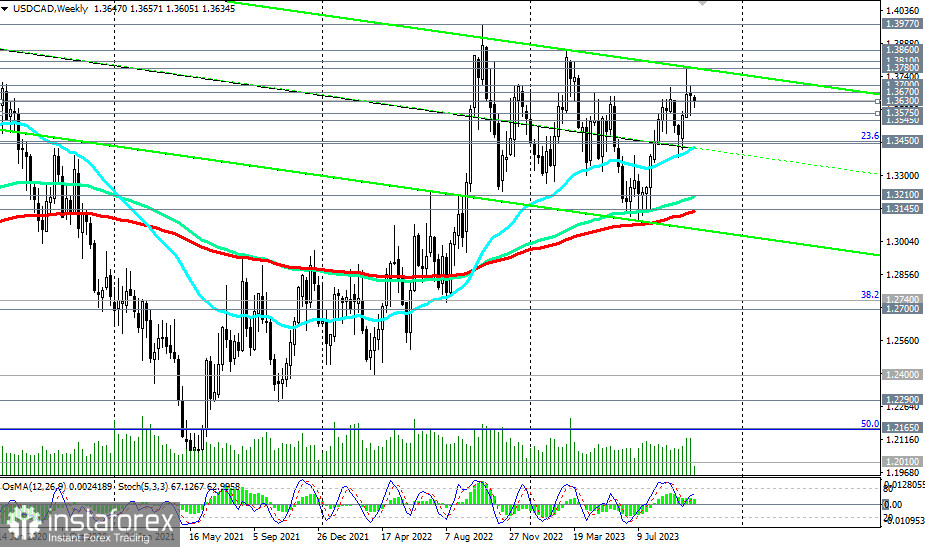
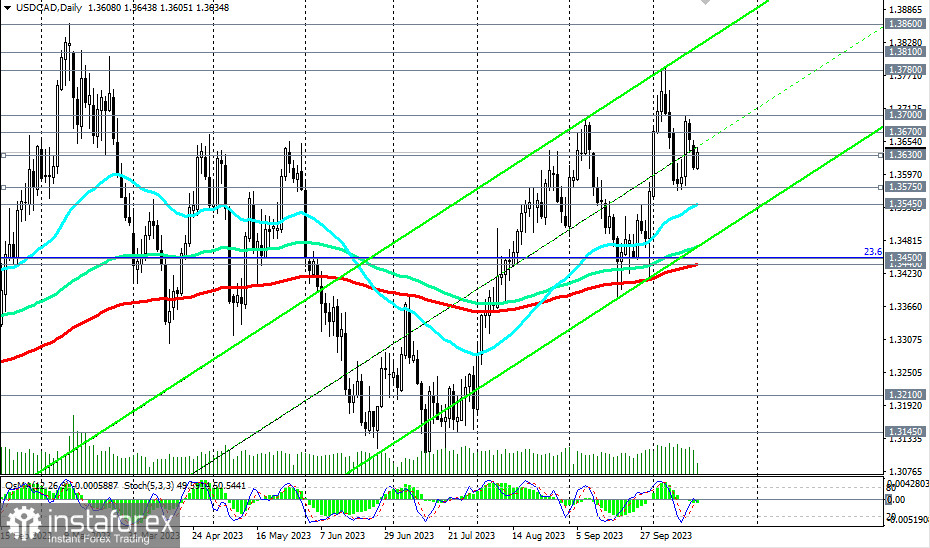
Furthermore, the pair is developing an upward trend, trading in the zone of medium-term (above the 1.3440 support level, 200 EMA on the daily chart), long-term (above the 1.3145 support level, 200 EMA on the weekly chart), and global (above the 1.2700 support level, 200 EMA on the monthly chart) bullish markets, also receiving support from fundamental factors.

Increased volatility in the quotes of the Canadian and American dollars is expected at 12:30 (GMT) today, which, in turn, should increase volatility in the USD/CAD pair.
In case of positive macro statistics for the USD and negative for the CAD, a breakout of today's high at 1.3643 will be a signal to increase long positions in USD/CAD, with targets for growth at local resistance levels of 1.3670, 1.3700, 1.3780, 1.3810, 1.3860.
In an alternative scenario, USD/CAD will resume its decline. The first signal for selling is a break of the 1.3630 support level, with confirmation at today's low of 1.3605.

Further development of this scenario, a break below key support levels of 1.3475 (144 EMA on the daily chart), 1.3450 (23.6% Fibonacci level correction in the upward wave from 0.9700 to 1.4600 reached in June 2016), 1.3440 (200 EMA on the daily chart), 1.3420 (50 EMA on the weekly chart), will return USD/CAD to the zone of the medium-term bearish market. A break of the support levels 1.3210 (144 EMA on the weekly chart) and 1.3145 (200 EMA on the weekly chart) will push the pair back into the long-term bearish market zone, making short positions preferable.
Support levels: 1.3630, 1.3600, 1.3575, 1.3545, 1.3500, 1.3450, 1.3440, 1.3420, 1.3400
Resistance levels: 1.3643, 1.3670, 1.3700, 1.3780, 1.3810, 1.3860, 1.3900, 1.3970, 1.4000
 English
 Русский
 Bahasa Indonesia
 Bahasa Malay
 ไทย
ไทย Español
 Deutsch
 Български
 Français
 Tiếng Việt
 中文
中文 বাংলা
বাংলা हिन्दी
 Čeština
 Українська
 Română

