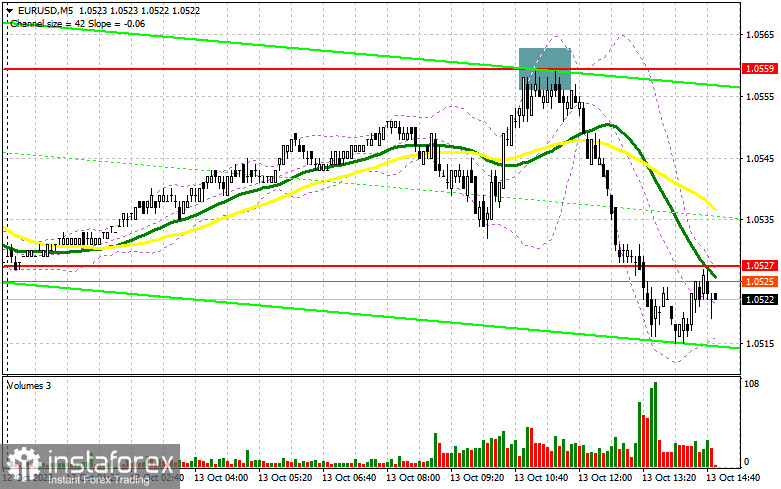
In my morning forecast, I drew attention to the level of 1.0559 and recommended making trading decisions based on it. Let's take a look at the 5-minute chart and analyze what happened there. The rise and the formation of a false breakout at 1.0559 led to an excellent entry point for short positions, resulting in a drop in the pair by more than 40 points. In the second half of the day, the technical picture was slightly revised.

To open long positions on EUR/USD:
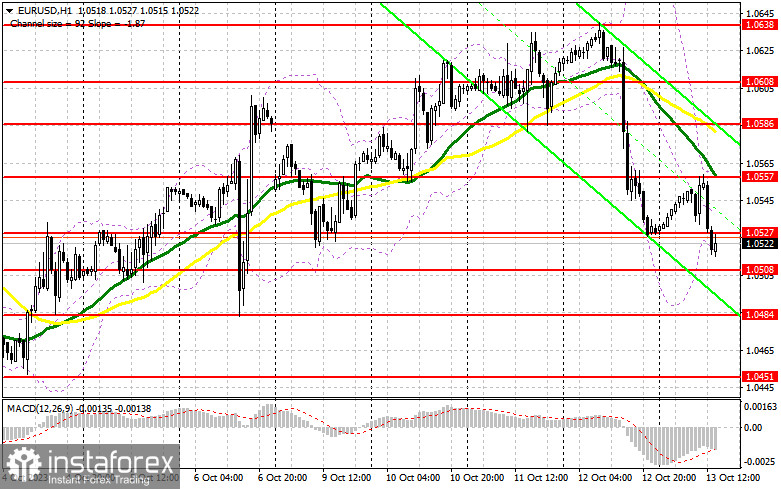
Euro sellers continued yesterday's trend, taking advantage of a good upward correction in the first half of the day. Ahead of us are data on the University of Michigan Consumer Sentiment Index and inflation expectations. If the indicators exceed economists' expectations, then the pressure on the pair is likely to persist and even intensify. In the event of further decline in the pair, I prefer to act after the formation of a false breakout around the new support level at 1.0508. It is precisely at this level that a divergence on the MACD indicator may form, providing a good entry point for long positions with the expectation of building an upward correction and compensating for part of the morning decline. The target will be the new resistance at 1.0557, formed at the end of the European session. Only a breakthrough and a top-down test of this range will provide a chance for a jump to 1.0586. The ultimate target will be the area at 1.0608, where I will make profits. In the case of EUR/USD declining and the absence of activity at 1.0508 in the second half of the day, pressure on the euro will persist, returning to the bearish trend. In this case, only the formation of a false breakout around 1.0484 will signal an entry into the market. I will consider opening long positions on a rebound from 1.0451 with the target of an intraday upward correction of 30-35 points.
To open short positions on EUR/USD:
If sellers are still present, I expect their manifestation in the second half of the day, around 1.0527. Another formation of a false breakout at this level and strong data from the US will signal a sale of the euro with a move down to support at 1.0508. A breakthrough and consolidation below this range, as well as a bottom-up retest, will lead to another selling signal with a target at the minimum of 1.0484, where the euro was actively bought on October 6. The ultimate target will be the area at 1.0451, where I will take profits. In the event of upward movement in EUR/USD during the American session and the absence of bears at 1.0527, which is likely to be the case if US data indicates a decline in consumer sentiment, buyers will try to reclaim the market at the end of the week. In such a scenario, I will postpone short positions until the resistance at 1.0557, from which we already fell once today. Selling can be done there, but only after an unsuccessful consolidation, similar to what I discussed above.


Indicator signals:
Moving averages
Trading is conducted below the 30 and 50-day moving averages, indicating further decline in the pair.
Note: The period and prices of the moving averages discussed by the author are based on the H1 hourly chart and differ from the general definition of classic daily moving averages on the D1 daily chart.
Bollinger Bands
In case of a decline, the lower boundary of the indicator at around 1.0520 will act as support.
Description of indicators:
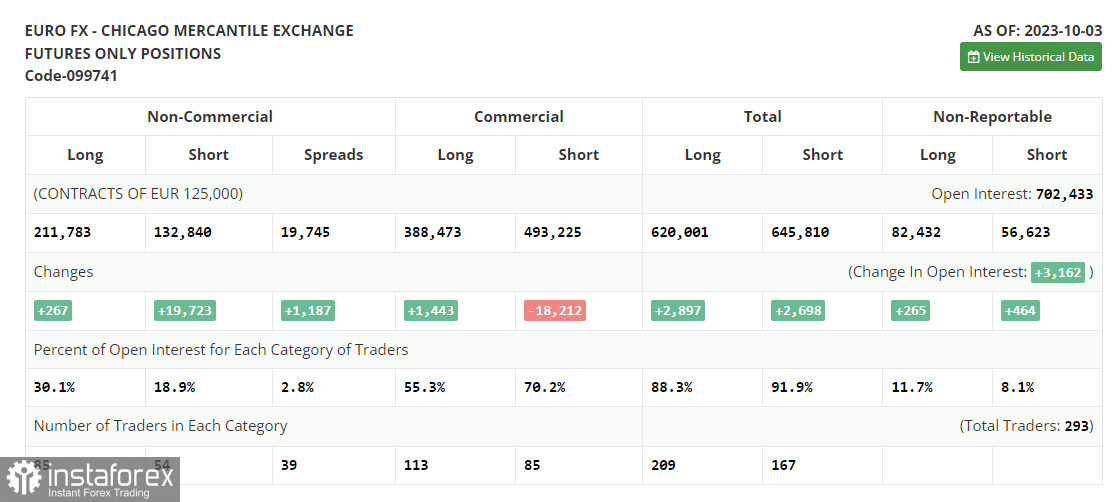
Moving average (determines the current trend by smoothing volatility and noise). Period 50. Marked in yellow on the chart.Moving average (determines the current trend by smoothing volatility and noise). Period 30. Marked in green on the chart.MACD (Moving Average Convergence/Divergence) indicator – Fast EMA period 12, Slow EMA period 26, SMA period 9.Bollinger Bands – Period 20.Non-commercial traders – speculators such as individual traders, hedge funds, and large institutions using the futures market for speculative purposes and meeting specific requirements.Long non-commercial positions represent the total long open positions of non-commercial traders.Short non-commercial positions represent the total short open positions of non-commercial traders.The total non-commercial net position is the difference between the short and long positions of non-commercial traders. English
 Русский
 Bahasa Indonesia
 Bahasa Malay
 ไทย
ไทย Español
 Deutsch
 Български
 Français
 Tiếng Việt
 中文
中文 বাংলা
বাংলা हिन्दी
 Čeština
 Українська
 Română

