EUR/USD

Higher Timeframes
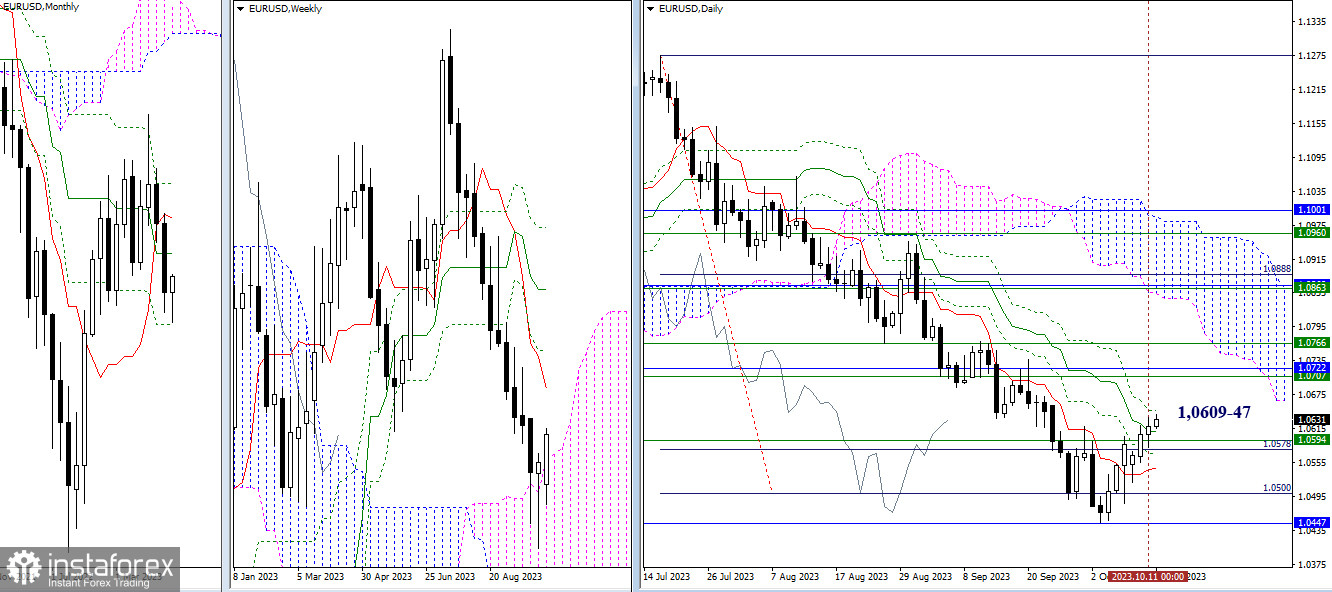
Bullish players' activity is currently reduced; nevertheless, they manage to update daily highs, contending with the resistance of the daily Ichimoku cross (1.0609 - 1.0647). The elimination of the daily cross will open the way to the resistance of higher timeframes at 1.0705 - 1.0722 (monthly medium-term trend + weekly short-term trend). In turn, the nearest support, attraction, and influence continue to be exerted by the zone of daily and weekly levels (1.0594 - 1.0571 - 1.0545).

H4 - H1
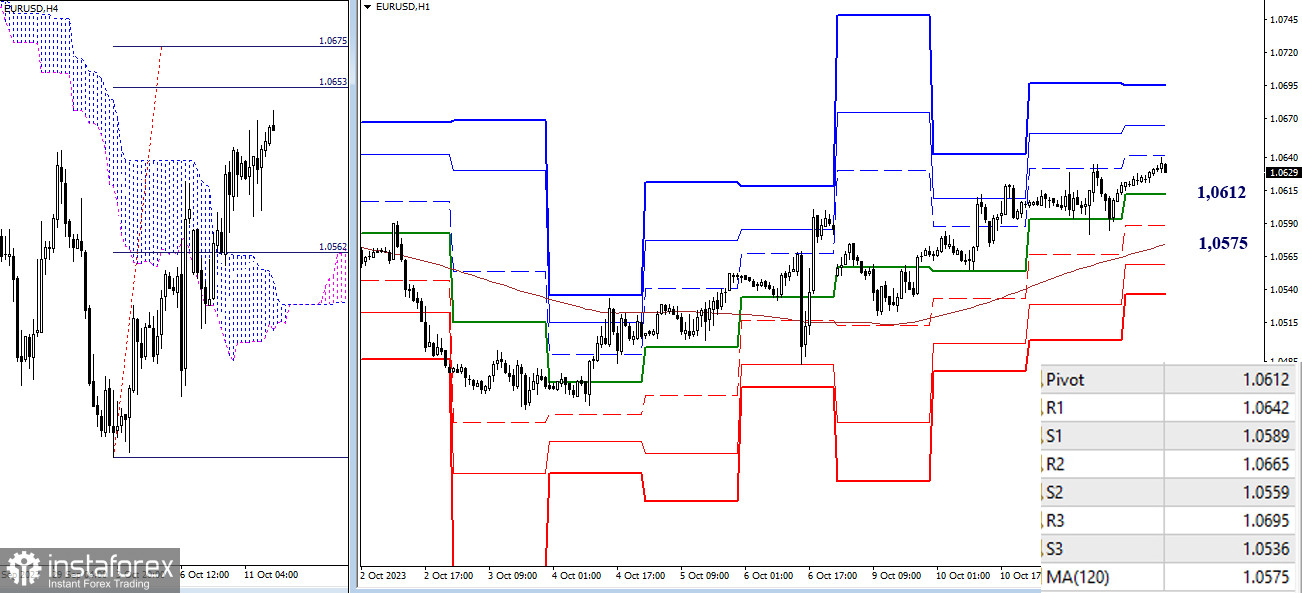
On the lower timeframes, the bulls still have the advantage, with intraday targets at 1.0642 - 1.0665 - 1.0695 (classic pivot points) and 1.0653 - 1.0675 (the target for breaking through the H4 cloud). Key levels currently still act as supports, with today's levels at 1.0612 (central pivot point of the day) and 1.0575 (weekly long-term trend). Consolidation below and a reversal of the movement can alter the current balance of power.
***
GBP/USD

Higher Timeframes
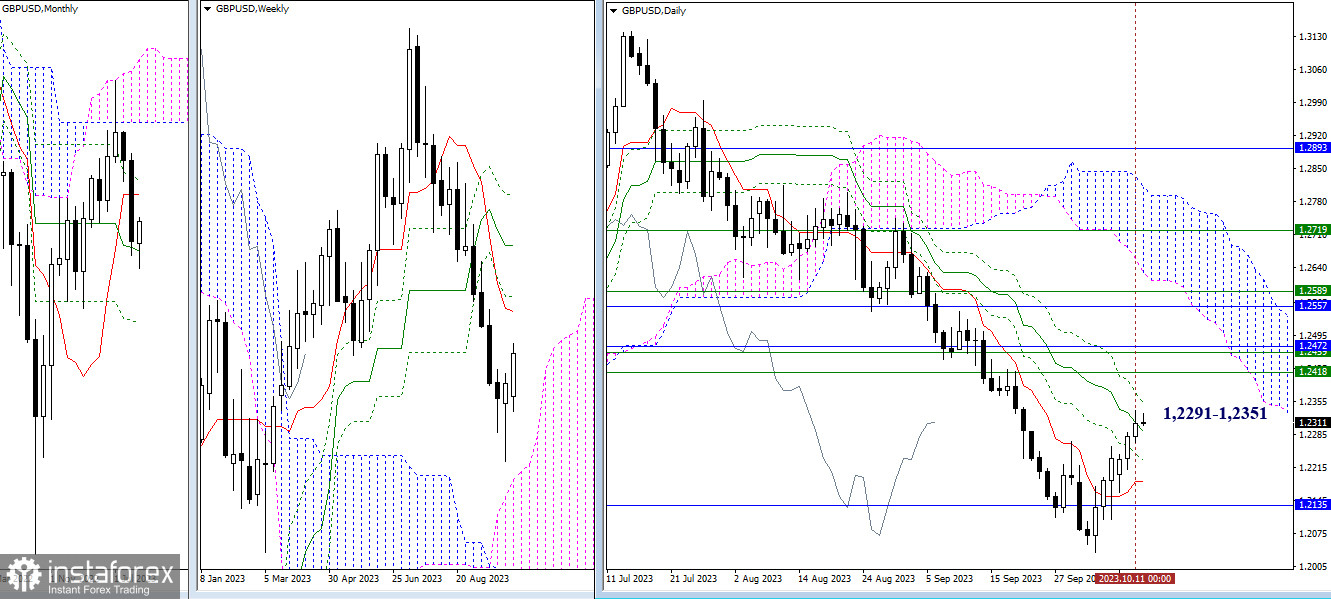
Bulls are currently testing the final levels of the death cross on the daily chart (1.2291 - 1.2351). A break of resistance and a consolidation above will allow a change in the daily balance and focus on new targets that combine weekly and monthly levels (1.2418-58-72). Forming a rebound will bring back the relevance of previously passed levels: 1.2231 - 1.2186 (daily Ichimoku cross levels) and 1.2135 (monthly medium-term trend).

H4 - H1
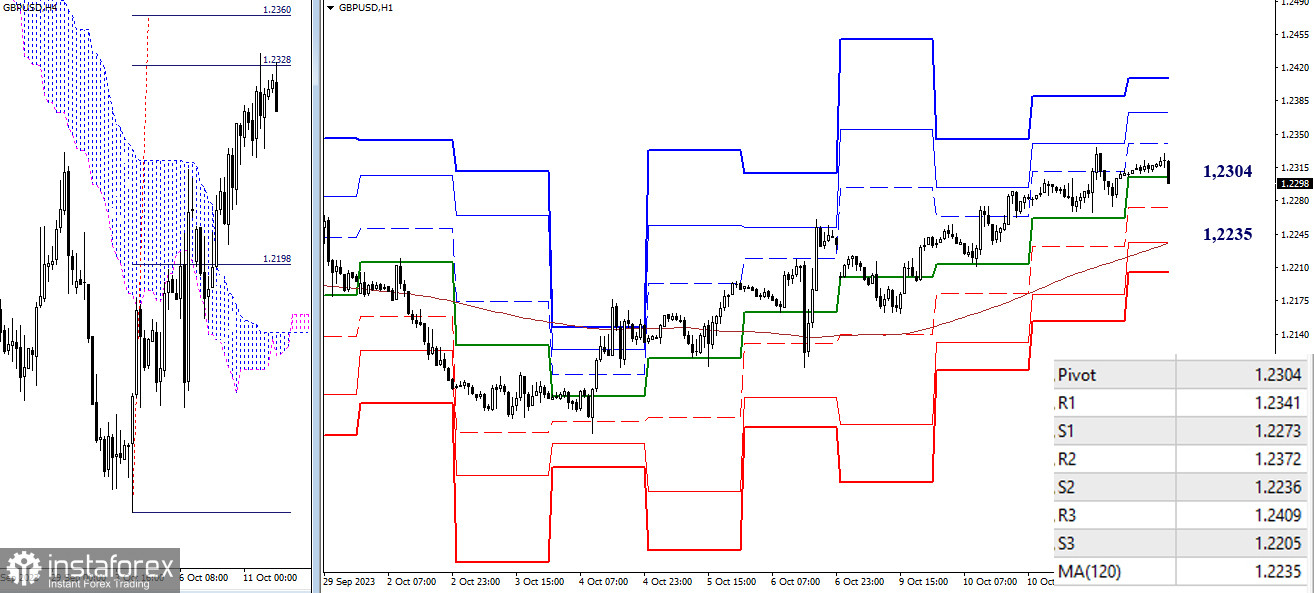
On the lower timeframes, the first target for breaking through the H4 cloud has been tested (1.2328). Further strengthening of bullish sentiment today can be realized by overcoming the resistance of classic pivot points (1.2341 - 1.2372 - 1.2409) and fully working out the H4 target (1.2360). If the emerging corrective decline materializes, after breaking through the central pivot point of the day (1.2304), the values may be 1.2273 (S1) and 1.2235 (weekly long-term trend). A break below and reversal of the movement can change the current advantage in favor of bears and further strengthen bearish sentiment.
***
The technical analysis of the situation uses:
Higher timeframes - Ichimoku Kinko Hyo (9.26.52) + Fibo Kijun levels
Lower timeframes - H1 - Pivot Points (classic) + Moving Average 120 (weekly long-term trend)
 English
 Русский
 Bahasa Indonesia
 Bahasa Malay
 ไทย
ไทย Español
 Deutsch
 Български
 Français
 Tiếng Việt
 中文
中文 বাংলা
বাংলা हिन्दी
 Čeština
 Українська
 Română

