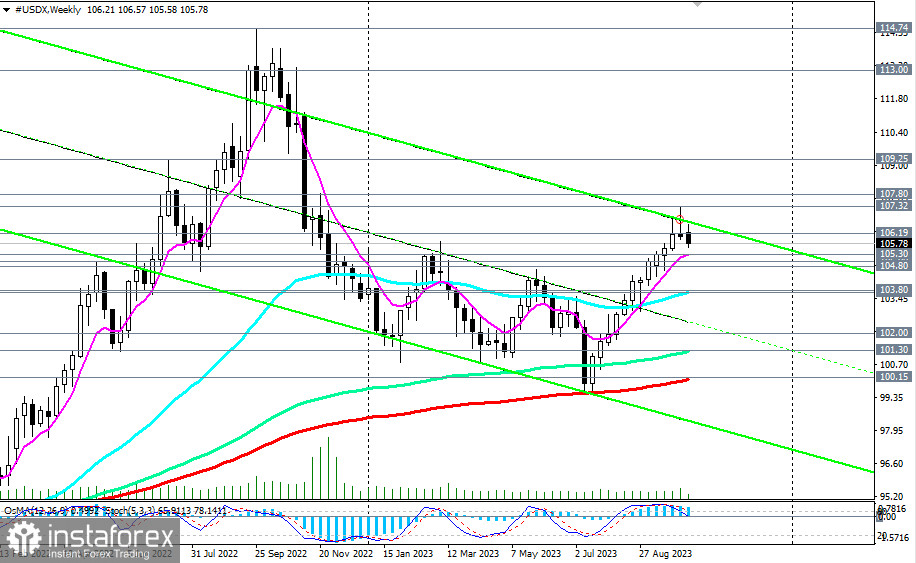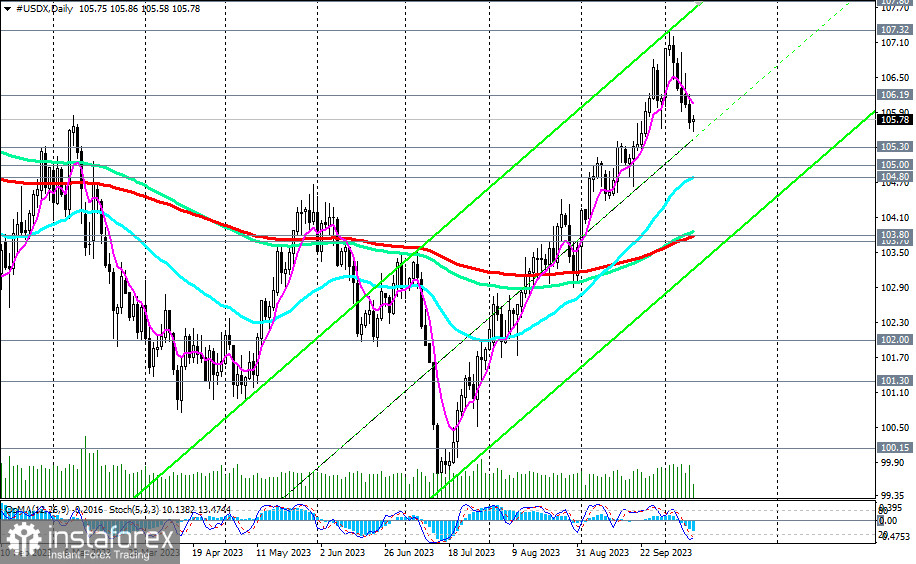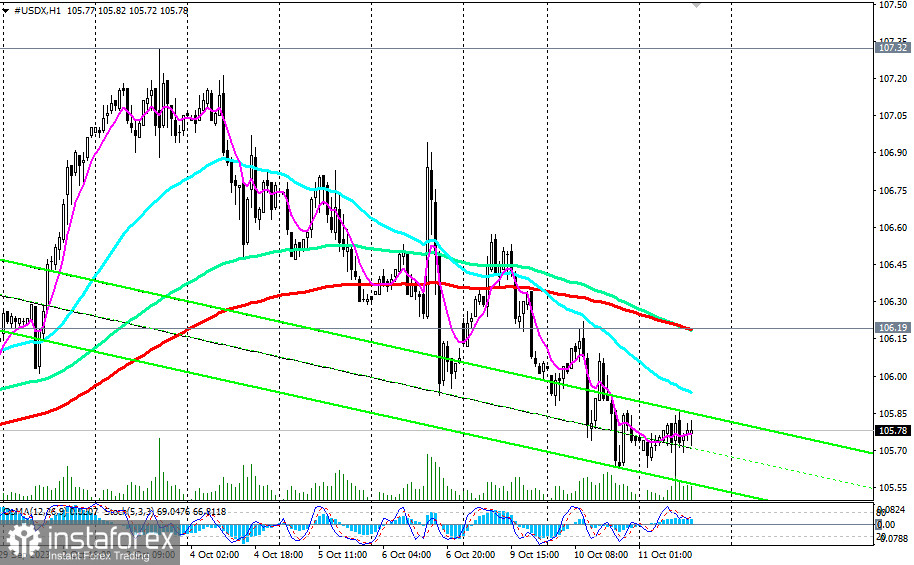
Last Friday, the dollar index (DXY) closed the week in negative territory for the first time in 11 consecutive weeks. In the first half of this week, the decline of the DXY accelerated, and the price (CFD #USDX in the MT4 terminal) reached a low not seen since September 26—at 105.58.
Nevertheless, on the eve of important publications, market participants prefer not to conduct major trading transactions.

Under favorable circumstances for the dollar, such as the tough rhetoric of the Fed minutes tests and an acceleration in inflation indicators, the DXY index has every chance to resume its upward momentum.
In this case, the price of CFD #USDX will break through the levels of yesterday and August, close to the 106.19 mark, as well as the crucial short-term resistance level (200 EMA on the 1-hour chart) and head towards the 11-month high and the monthly high reached at the 107.32 mark.
From a technical standpoint, the DXY index (CFD #USDX) is trading in the territory of a stable bullish market, with a medium-term outlook above the key level of 103.80 (200 EMA on the daily chart) and a long-term perspective above the key support levels of 101.30 (144 EMA on the weekly chart), 100.15 (200 EMA on the weekly chart), and 100.00.

In this situation, despite the corrective decline, long positions remain preferable.
In an alternative scenario, breaking through the key support levels of 103.80 and 103.70 would return the DXY to the medium-term bearish market zone.
The first signal to start implementing this scenario and open short positions could be breaking through the local support level and today's low at 105.58.
Furthermore, if the DXY continues to decline and breaks through the key support level at 100.00, it would create the conditions for its entry into the long-term bearish market zone.
Support levels: 105.58, 105.30, 105.00, 104.80, 104.00, 103.80, 103.70, 103.00, 102.00, 101.10, 100.15, 100.00
Resistance levels: 106.19, 107.00, 107.32, 107.80, 108.00, 109.00, 109.25
 English
 Русский
 Bahasa Indonesia
 Bahasa Malay
 ไทย
ไทย Español
 Deutsch
 Български
 Français
 Tiếng Việt
 中文
中文 বাংলা
বাংলা हिन्दी
 Čeština
 Українська
 Română

