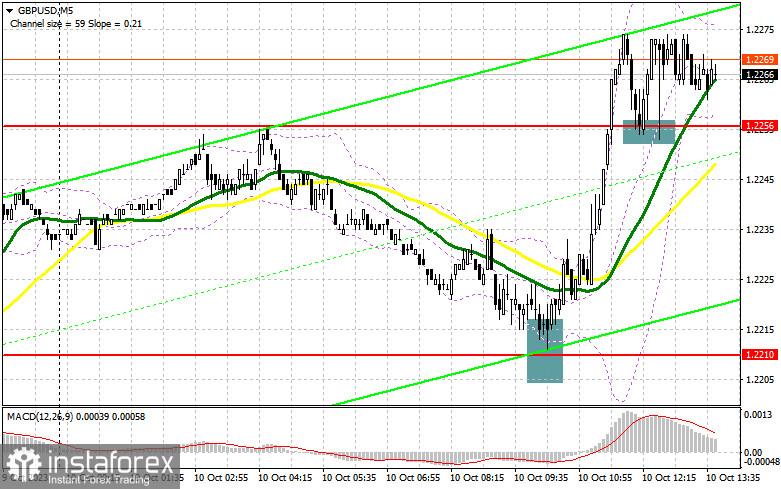
In my morning forecast, I pointed out the level of 1.2210 and recommended making decisions based on it for market entry. Let's take a look at the 5-minute chart and analyze what happened there. The decline and the formation of a false breakout at 1.2210 allowed for a good entry point for continuing the pair's recovery, resulting in GBP/USD rising by more than 40 points. The breakthrough and consolidation above 1.2256 also gave a signal to increase long positions, which is still in effect as of the time of writing this review.

To open long positions on GBP/USD, the following is required:
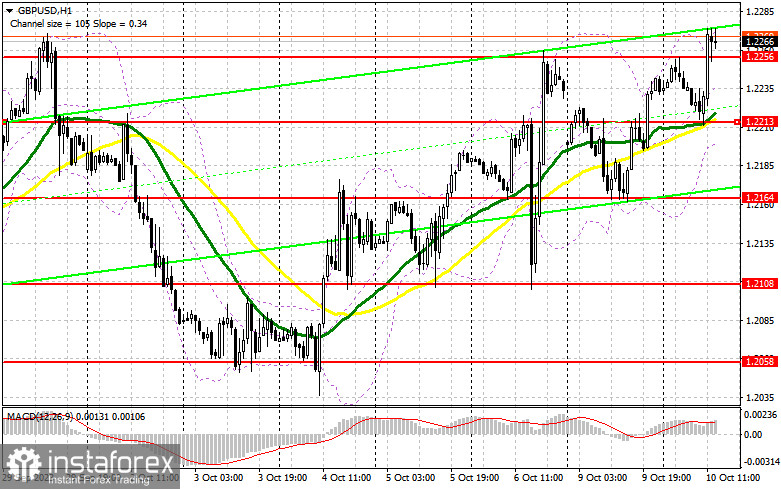
The bullish reaction to the Bank of England's summary led to an update of fairly significant highs. However, as you can see on the chart, achieving a continuation of the upward correction has not been successful so far. Ahead of us, we only have an indicator of optimism in the small business sector from NFIB and a series of speeches by FOMC representatives, including Raphael Bostic, Christopher Waller, and Neil Kashkari. Hawkish statements from policymakers after Friday's labor market data could put pressure on the pair. For this reason, I prefer to act after a decline and the formation of a false breakout around the support level of 1.2256, which will signal a buy opportunity with the aim of a jump to a new high around 1.2303. Breaking through and consolidating above this range will allow buyers to establish their new bullish trend, providing a chance to reach 1.2342. The ultimate target will be the area around 1.2380, where I will make profits. In the scenario of a decline to 1.2256 and the absence of activity there in the second half of the day, which is likely to happen, trading will move into a sideways channel, and the situation for pound buyers will worsen again. This will also open the way to 1.2213. A false breakout there, similar to what I discussed earlier, will signal an opportunity to open long positions. I plan to buy GBP/USD only on a rebound from the minimum of 1.2164, targeting a correction of 30-35 points within the day.
To open short positions on GBP/USD, the following is required:
Bears need to return trading below 1.2256 as quickly as possible because closing the market above this level will seriously challenge the ability of sellers to regain the trend. In the event of a bullish reaction to the speeches of American politicians, only a false breakout of the nearest resistance at 1.2303 will signal a sell opportunity capable of pushing the pair down to 1.2256. Breaking through and testing this range from below will deal a more serious blow to bullish positions, paving the way to 1.2213, where moving averages supporting the bulls are located. The next target will be 1.2164, where I will take profits. In the case of GBP/USD continuing to rise during the American session and the absence of bears at 1.2303, which is likely to happen, buyers will have a chance to continue the upward correction. In this case, I will postpone selling until a false breakout at 1.2342. If there is no downward movement at that level, I will sell the pound immediately on a rebound from 1.2380, but only with the expectation of a pair's downward correction of 30-35 points within the day.


Indicator Signals:
Moving Averages
Trading is conducted above the 30 and 50-day moving averages, indicating the continuation of the pair's growth.
Note: The period and prices of the moving averages are considered by the author on the H1 hourly chart and differ from the general definition of classical daily moving averages on the D1 daily chart.
Bollinger Bands
In the case of a decline, the lower boundary of the indicator around 1.2210 will act as support.
Description of indicators:
• Moving average (determines the current trend by smoothing volatility and noise). Period 50. Marked in yellow on the chart.
• Moving average (determines the current trend by smoothing volatility and noise). Period 30. Marked in green on the chart.
• MACD indicator (Moving Average Convergence/Divergence - convergence/divergence of moving averages). Fast EMA period 12. Slow EMA period 26. SMA period 9.
• Bollinger Bands. Period 20.
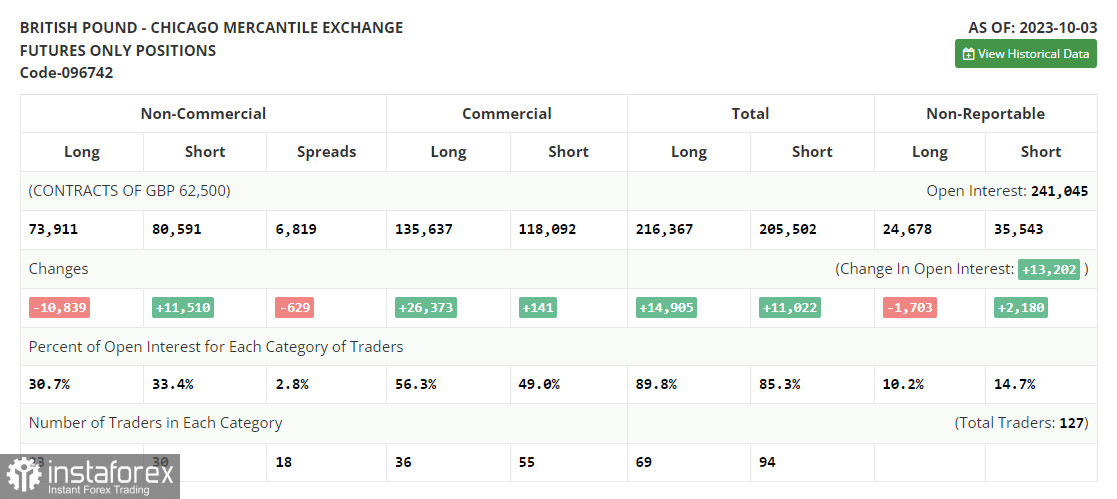
• Non-commercial traders - speculators, such as individual traders, hedge funds, and large institutions, using the futures market for speculative purposes and meeting specific requirements.
• Long non-commercial positions represent the total long open positions of non-commercial traders.
• Short non-commercial positions represent the total short open positions of non-commercial traders.
• The total non-commercial net position is the difference between the short and long positions of non-commercial traders.
 English
 Русский
 Bahasa Indonesia
 Bahasa Malay
 ไทย
ไทย Español
 Deutsch
 Български
 Français
 Tiếng Việt
 中文
中文 বাংলা
বাংলা हिन्दी
 Čeština
 Українська
 Română

