EUR/USD
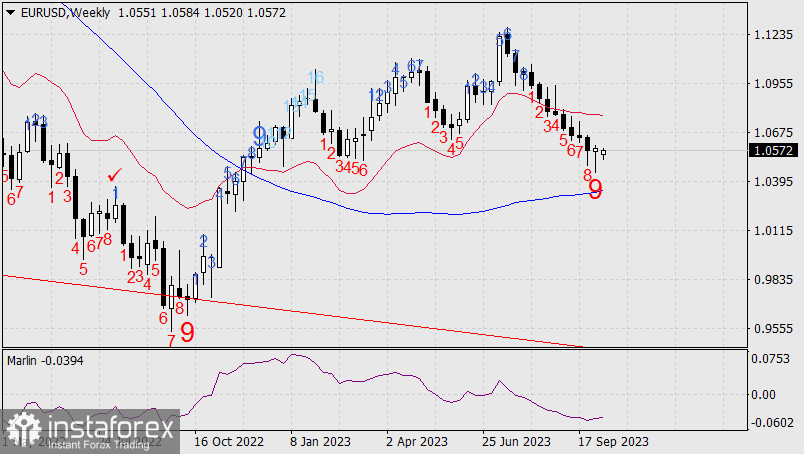
Let's go back to the weekly chart with the Sequential indicator that we discussed recently. The reversal occurred after 11 consecutive black candles, with the reversal happening on the 9th reversal candle according to the counting method of this cyclic strategy.

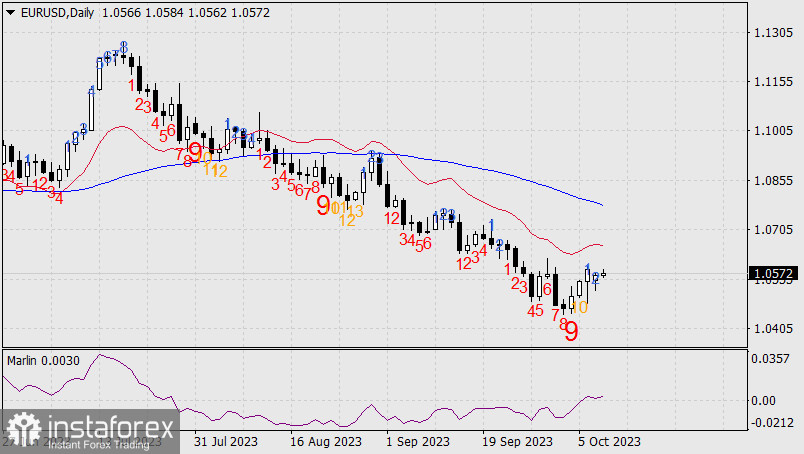
On the daily chart, we also witnessed a reversal from the 9th candle, afterwards an intermediate 10th candle formed, marking the start of a new upward wave. We expect the pair to rise in the medium-term, possibly even surpassing the last peak in July.

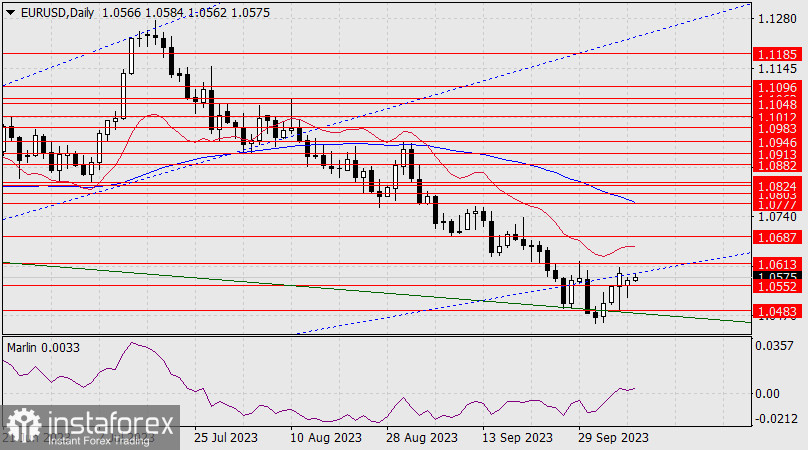
The basis for this growth is the complex situation regarding the U.S. budget compared to what it was just a week ago. On the daily chart, we can see that the euro failed to fall below 1.0552 as the daily candle opened and closed above this level:

Now, the price needs to overcome the Fibonacci retracement ray resistance and the level above it at 1.0613. The Marlin oscillator remained in the bullish territory yesterday. The target for this growth is no lower than the MACD line, which is currently at the level of 1.0777.

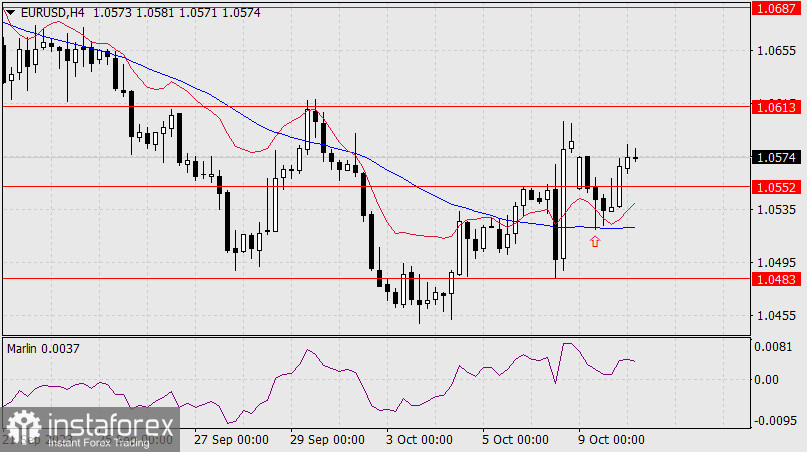
On the 4-hour chart, the price has turned upwards from the MACD line, and at the moment, it has consolidated above the level of 1.0552. The Marlin oscillator has not left the uptrend territory. We expect the euro to rise further.
 English
 Русский
 Bahasa Indonesia
 Bahasa Malay
 ไทย
ไทย Español
 Deutsch
 Български
 Français
 Tiếng Việt
 中文
中文 বাংলা
বাংলা हिन्दी
 Čeština
 Українська
 Română

