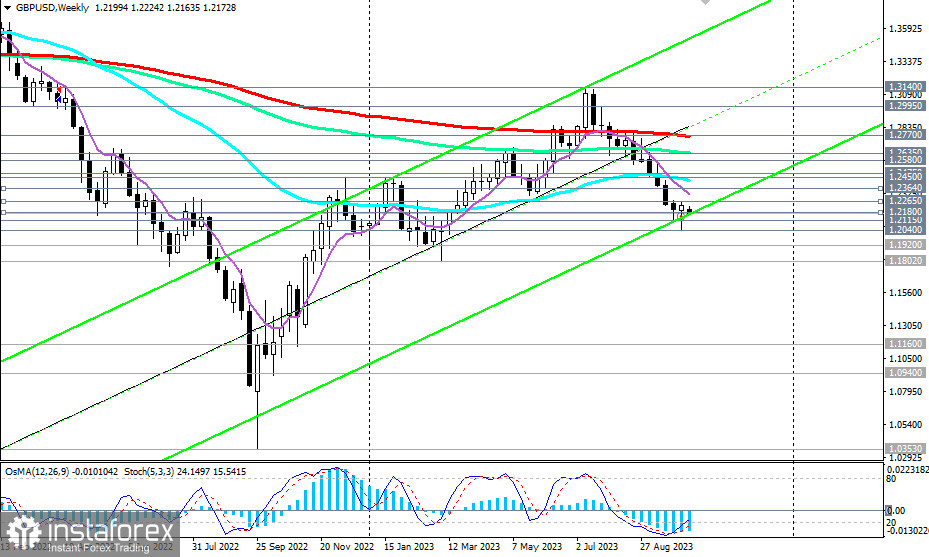
The GBP/USD pair rose last week. However, this can largely be attributed to the weakening of the dollar rather than the strengthening of the pound.
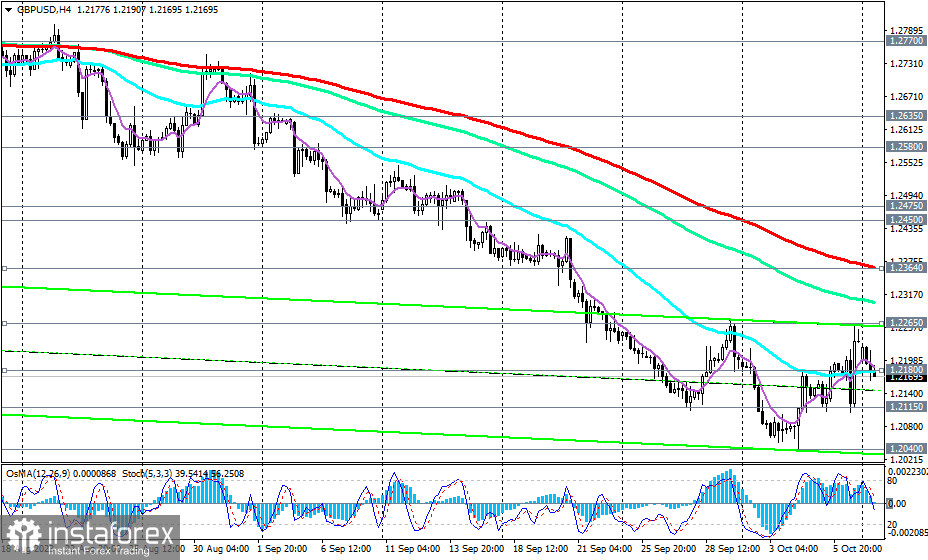
At the beginning of the new week, GBP/USD is declining again, and as of writing, it is testing the important short-term support level of 1.2180 (200 EMA on the 1-hour chart).

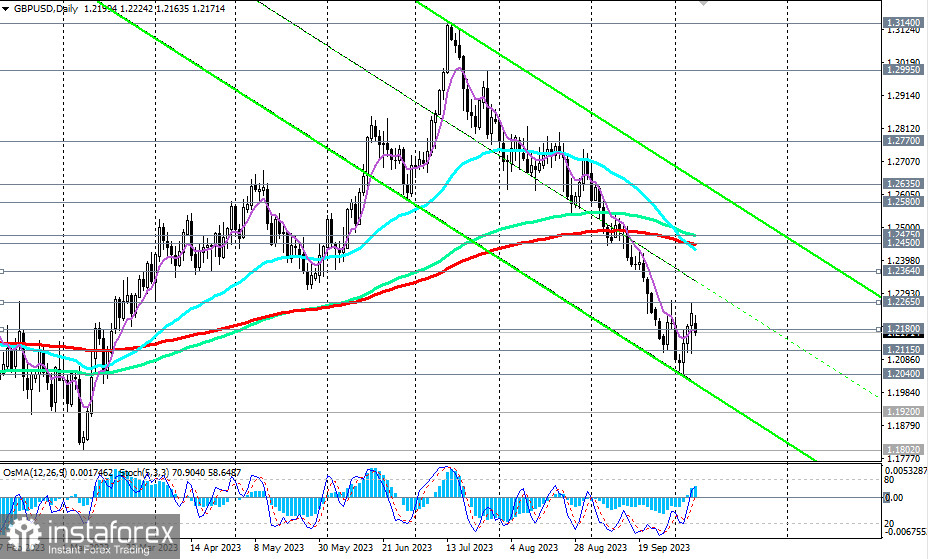
Meanwhile, the pair remains within the medium-term and long-term bearish markets, below the key levels of 1.2450 (200 EMA on the daily chart) and 1.2770 (200 EMA on the weekly chart), respectively.
In the event of a continued decline and a break of today's low at 1.2164, it may signal a resumption of short positions with the nearest target near the local low of 1.2040.

In an alternative scenario, after breaking through the resistance levels at 1.2180, 1.2200, and 1.2260, a corrective rise may resume towards the resistance level 1.2364 (200 EMA on the 4-hour chart).
In the case of further growth and a break above the key resistance levels at 1.2450 (200 EMA on the daily chart) and 1.2475 (144 EMA on the daily chart), the price will return to the medium-term bullish market zone, and after breaking through the key resistance level at 1.2770 (200 EMA on the weekly chart), it will enter the long-term bullish market zone.
The first signal to resume buying may be a break of today's high at 1.2224.
Support levels: 1.2164, 1.2115, 1.2100, 1.2040, 1.2000, 1.1920, 1.1900, 1.1800
Resistance levels: 1.2224, 1.2265, 1.2300, 1.2364, 1.2400, 1.2460, 1.2475, 1.2500, 1.2580, 1.2600, 1.2650, 1.2700, 1.2770, 1.2800, 1.2900, 1.3000, 1.3100, 1.3140, 1.3200
 English
 Русский
 Bahasa Indonesia
 Bahasa Malay
 ไทย
ไทย Español
 Deutsch
 Български
 Français
 Tiếng Việt
 中文
中文 বাংলা
বাংলা हिन्दी
 Čeština
 Українська
 Română

