Formally, the eurozone labor market showed improvement as the unemployment rate was 6.4% in August 2023, down from 6.5% in July 2023. However, in reality, the data was slightly worse than expected, as unemployment was expected to rise from 6.4% to 6.5%. So, in general, unemployment remained unchanged, but the situation was slightly worse than anticipated. This had to be considered because it was the reason why the dollar continued to strengthen its position. As a result, the single currency pulled down not only the pound but other currencies as well. The dollar's broad strength also had an impact on the commodities market.
However, the dollar has overcome something like psychological levels and remains excessively overbought. So, the market will grab any reason for a correction, even a local one. It's possible that today's US JOLTS report, which is expected to decrease from 8.8 million to 8.6 million, could play this role. In reality, this does not provide a clear answer about the state of the labor market. However, given the less than upbeat forecasts regarding Friday's labor report, it will be perceived as a negative factor. This could be a reason for the dollar to fall.

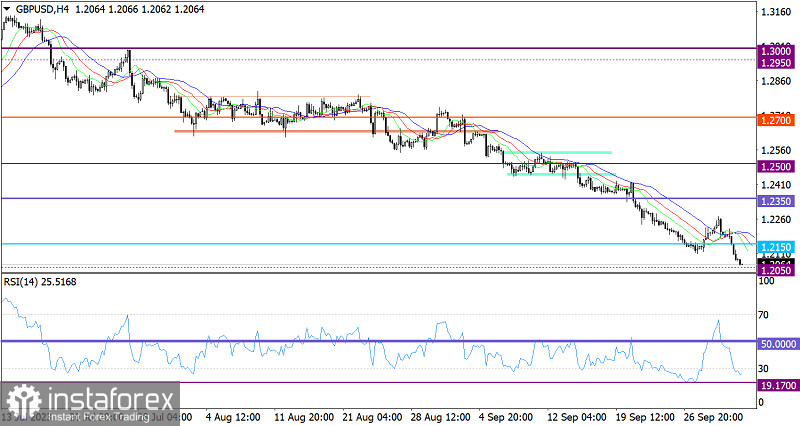
The corrective phase ended as quickly as it began in the market. As a result, the volume of short positions increased, making it possible for the bears to update the local low of the downward cycle.
The RSI technical indicator shows that the pair looks oversold on the four-hour chart. The indicator is also moving below the 30 level.
Meanwhile, after the Alligator's MAs briefly intertwined in the 4-hour chart, we witnessed a downward movement, which is in line with the pair's main direction.
Outlook
The downward movement has caused the British pound to lose almost 200 pips. Considering its oversold status, there is a possibility of reducing the volume of short positions, which allows for a technical rebound. Traders consider the psychological level of 1.2000 as support.
Complex indicator analysis indicates a downtrend in the short-, mid- and long-term timeframes.
 English
 Русский
 Bahasa Indonesia
 Bahasa Malay
 ไทย
ไทย Español
 Deutsch
 Български
 Français
 Tiếng Việt
 中文
中文 বাংলা
বাংলা हिन्दी
 Čeština
 Українська
 Română

