Analysis of GBP/USD 5M

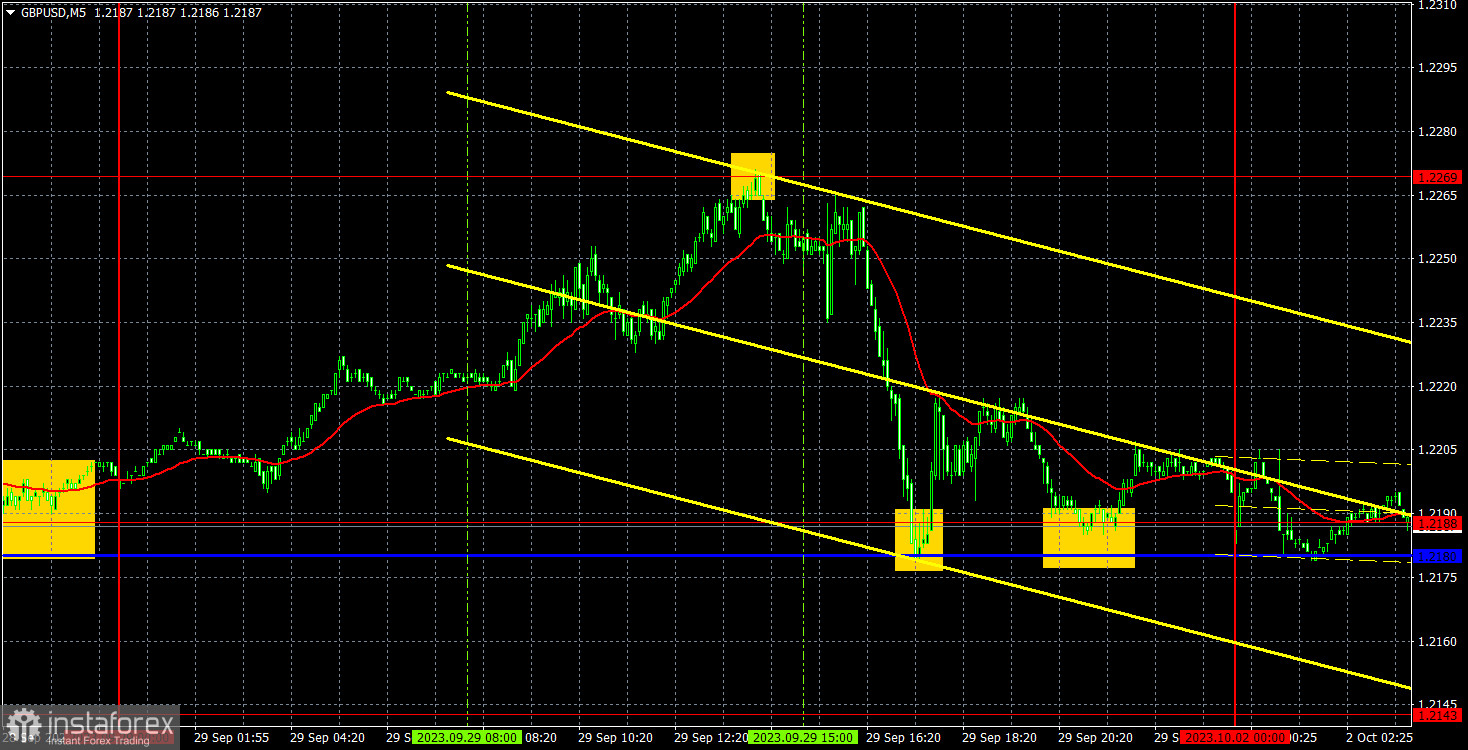
The GBP/USD pair carried on with its upward movement on Friday. In principle, the price covered the distance from 1.2188 to 1.2269 during the Asian and European trading sessions. However, the price plummeted back to the level of 1.2188 within just a couple of hours of the American session, where it remained until the end of the day. Like in the case of the euro, we cannot attribute these movements to fundamental or macroeconomic factors. Simply put, there wasn't any significant "fundamental" on Friday, and the macroeconomic reports were either uneventful or of secondary importance. Therefore, it's unlikely that the movements we witnessed were reactions to these publications, especially the drop in GBP/USD in early hours of the American session.
On the other hand, the trading signals were excellent on Friday. It's a pity that we couldn't catch the morning upward movement, but the bounce from the level of 1.2269 suggested opening short positions. Later on, the instrument slid to the level of 1.2188 and bounced off it. At this point, it was necessary to close sell orders and even open long ones, which, unfortunately, didn't yield any profit as GBP/USD didn't show significant movements for the rest of the day. The profit from the first trade was 55 pips. The overall daily volatility was around 95 pips, which is not particularly high.
COT report

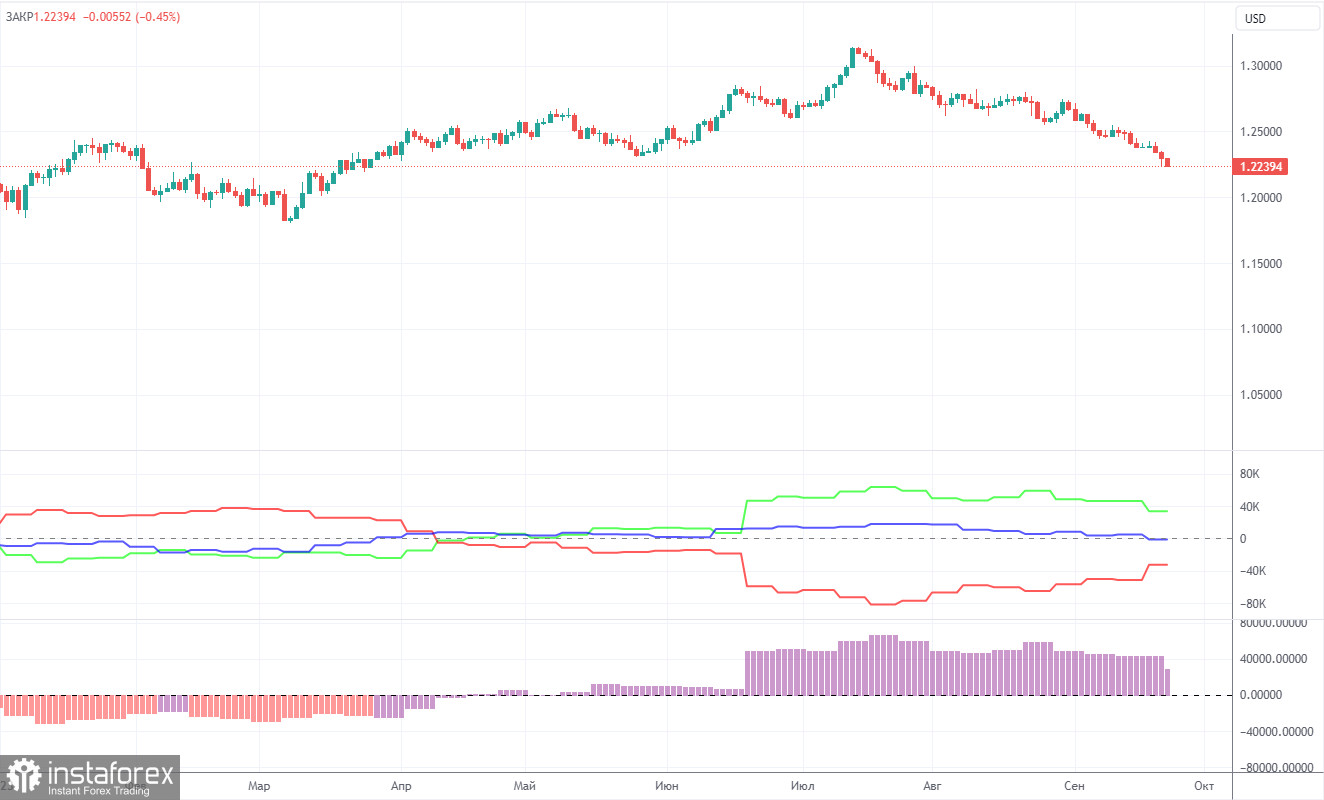
According to the latest report on GBP/USD, the "Non-commercial" group closed 0.3K BUY contracts and opened 17.7K SELL contracts. Thus, the net position of non-commercial traders decreased by another 18.0K contracts in a week. The net position indicator has been steadily rising over the past 12 months, but it has been firmly decreasing over the past two months. The British pound is also losing ground. We have been waiting for many months for the sterling to reverse downwards. Perhaps GBP/USD is at the very beginning of a prolonged downtrend. At least in the coming months, we do not see significant prospects for the pound to rise.
The British pound has surged by a total of 2,800 pips from its absolute lows reached last year, which is an enormous increase. Without a strong downward correction, a further upward trend would be entirely illogical (if it is even planned). We don't rule out an extension of an uptrend. We simply believe that a substantial correction is needed first, and then we should assess the factors supporting the US dollar and the British pound. A correction to the level of 1.1843 would be sufficient to establish a fair equilibrium between the two currencies. The "Non-commercial" group currently holds a total of 84.7K BUY contracts and 69.0K SELL contracts. The bears have been holding the upper hand in recent months, and we believe this trend will continue in the near future.
Analysis of GBP/USD 1H

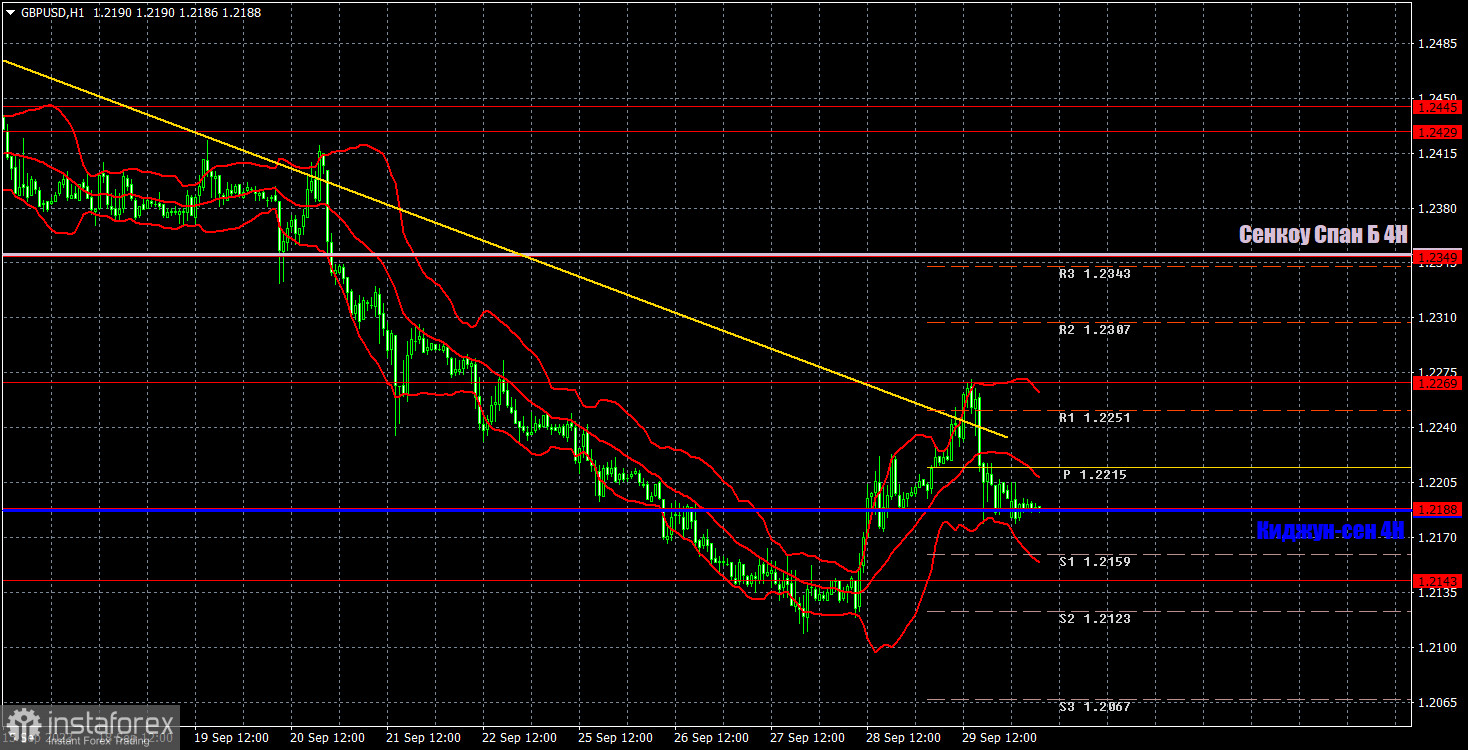
On the 1-hour timeframe, the GBP/USD pair has begun the long-awaited correction. The pound, as before, is poised to go downward. So, we do not believe that its decline in 2023 is over. We have long talked about the only justified movement option for the pound – a decline. Indeed, the pound has depreciated by 1,000 pips over the past two months, which is entirely justified. The trendline is still relevant, but consolidating above the Kijun-sen allows us to expect movement towards the Senkou Span B line.
As of October 2, we highlight the following important levels: 1.1760, 1.1874, 1.1927-1.1965, 1.2143, 1.2188, 1.2269, 1.2349, 1.2429-1.2445, 1.2520, 1.2605-1.2620, and 1.2693. The Senkou Span B (1.2350) and Kijun-sen (1.2187) lines can also be sources of signals. Signals can be "bounces" and "breakouts" of these levels and lines. It is recommended to set the Stop Loss level to break-even when the price moves in the right direction by 20 pips. The Ichimoku indicator lines can move during the day, which should be taken into account when determining trading signals. The illustration also includes support and resistance levels that can be used to lock in profits from trades.
On Monday, manufacturing sector PMIs for September will be published in the UK and the US, but it makes sense to pay attention only to the ISM index in the US. In the evening, Jerome Powell will deliver a speech. Market participants will be looking for clues as to whether the Federal Reserve would raise the key interest rate again at the next meeting.
What's on charts
Price levels of support and resistance (resistance / support) are plotted by thick red lines, near which the movement may end. They are not sources of trading signals.
The Kijun-sen and Senkou Span B lines are the Ichimoku indicator lines transferred to the 1-hour timeframe from the 4-hour timeframe. They are strong lines.
Extreme levels are thin red lines, from which the price bounced or dipped earlier. They are sources of trading signals.
Yellow lines are trend lines, trend channels and any other technical patterns.
Indicator 1 on the COT charts means the size of the net position of each category of traders.
Indicator 2 on the COT charts means the size of the net position for the Non-commercial group.
 English
 Русский
 Bahasa Indonesia
 Bahasa Malay
 ไทย
ไทย Español
 Deutsch
 Български
 Français
 Tiếng Việt
 中文
中文 বাংলা
বাংলা हिन्दी
 Čeština
 Українська
 Română

