Positive macroeconomic data continue to come in from the United States, increasing the likelihood of the Federal Reserve keeping interest rates at high levels. This is a bullish factor for the dollar and bearish for gold, whose prices are highly sensitive to changes in the credit and monetary policy parameters of the world's largest central banks, primarily the Federal Reserve.
Among the positive factors for gold are the persistent geopolitical uncertainty, still-high inflation levels, and potential issues in economic growth. There are also expectations of a possible shift in the direction of the Federal Reserve's monetary policy as early as next year.

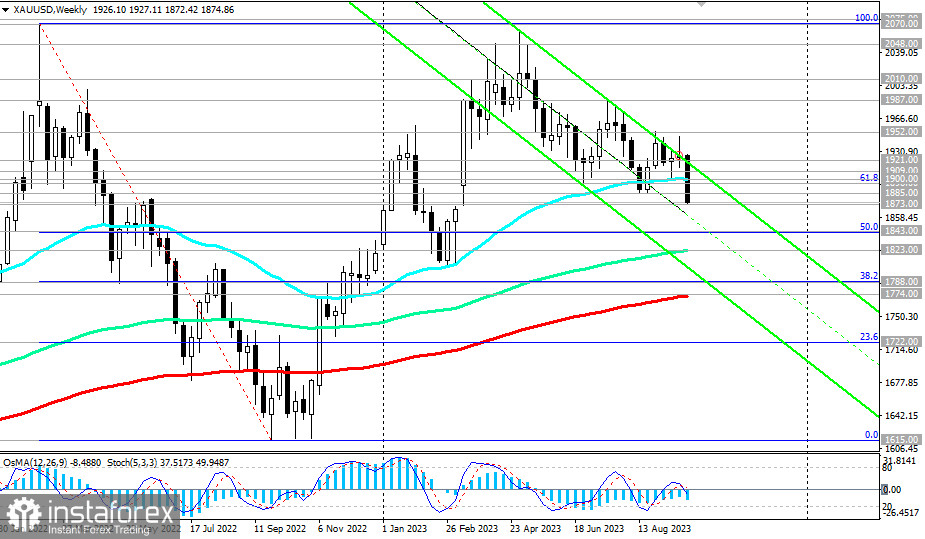
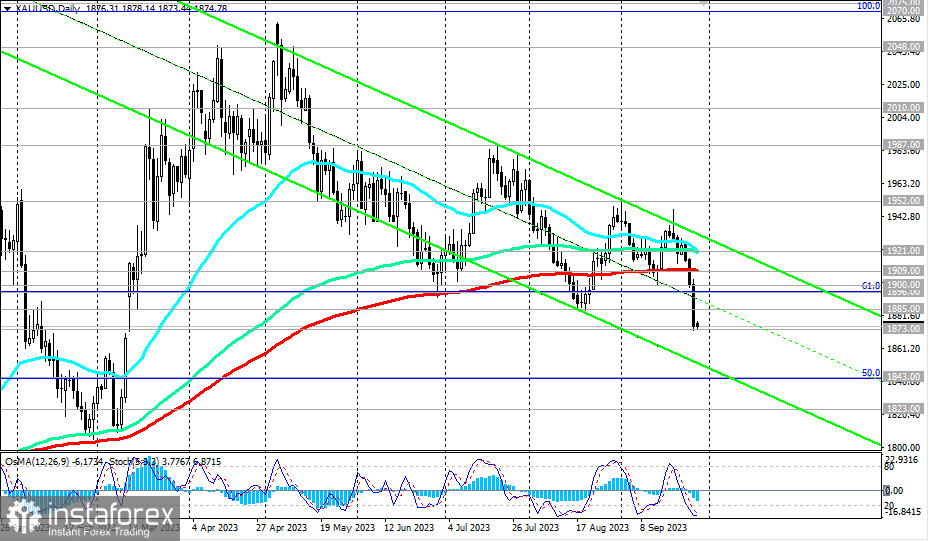
From a technical perspective, after breaking through key support levels last week at 1909.00 (200 EMA on the daily chart) and 1900.00 (50 EMA on the weekly chart), XAU/USD entered the medium-term bearish market zone.
In the case of further decline, the target levels become 1843.00 (50% Fibonacci level in the downward correction wave from its peak at 2070.00 to its low at 1615.00), 1823.00 (144 EMA on the weekly chart), and 1800.00. Breaking through the key support level at 1774.00 (200 EMA on the weekly chart) will place XAU/USD in the long-term bearish market zone.

In the main scenario, we expect a resumption of growth. In this case, the price will break through resistance levels at 1909.00, 1921.00 (144 EMA, 50 EMA on the daily chart), and resume its upward movement. The nearest growth target is the local resistance level at 1952.00, with more distant targets at local resistance levels at 1987.00, 2000.00, and 2010.00.
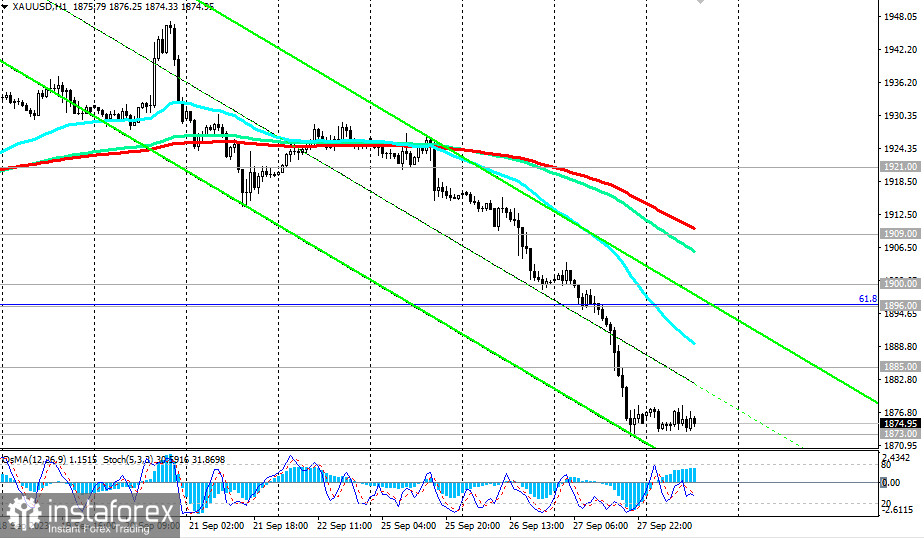
A breakout of today's high at 1878.00 may be the earliest signal for XAU/USD buyers.
Support levels: 1873.00, 1843.00, 1823.00, 1800.00, 1788.00, 1774.00, 1722.00
Resistance levels: 1878.00, 1885.00, 1896.00, 1900.00, 1909.00, 1921.00, 1952.00, 1987.00, 2000.00, 2010.00, 2048.00, 2070.00
 English
 Русский
 Bahasa Indonesia
 Bahasa Malay
 ไทย
ไทย Español
 Deutsch
 Български
 Français
 Tiếng Việt
 中文
中文 বাংলা
বাংলা हिन्दी
 Čeština
 Українська
 Română

