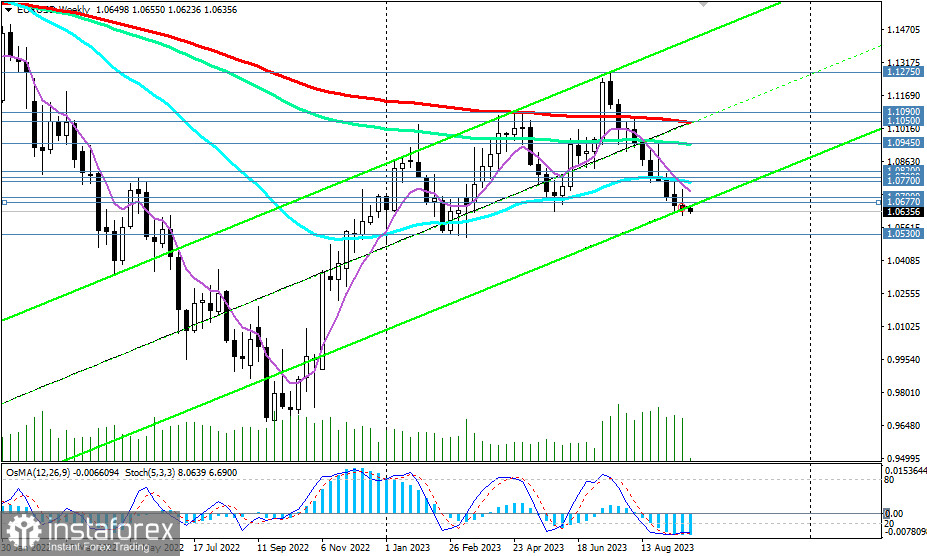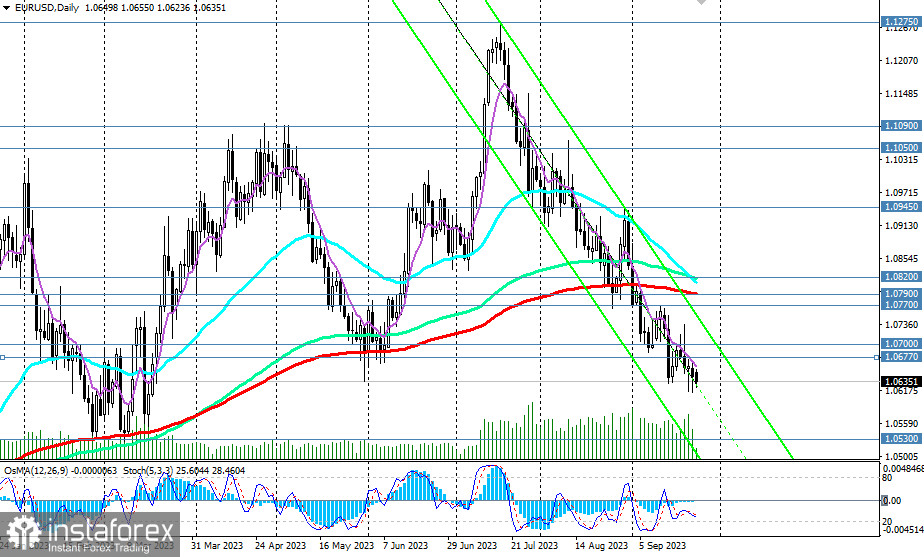
EUR/USD has been declining for the 11th consecutive week, moving within the medium-term and long-term bearish markets, respectively, below the key resistance levels of 1.0790 (200 EMA on the daily chart) and 1.1050 (200 EMA on the weekly chart), making short positions preferable.
ECB President Christine Lagarde is unlikely to change her tone in favor of a more stringent ECB monetary policy. Although surprises from her side are not excluded, waiting for a significant strengthening of the euro and an increase in the EUR/USD pair after her speech is unlikely to be appropriate.

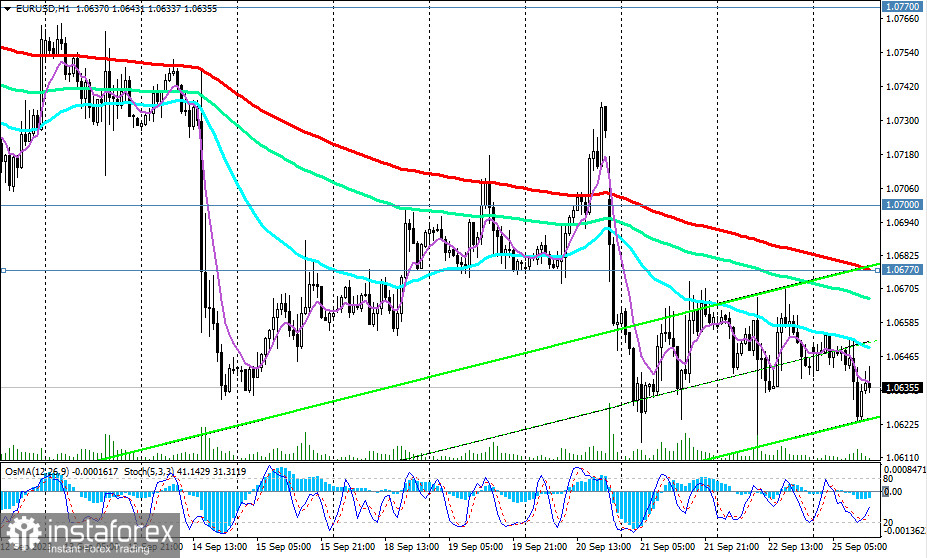
Most likely, EUR/USD will continue to decline, and a break of the local support at 1.0615 and 1.0600 will signal an increase in short positions.
In an alternative scenario, Lagarde may surprise the markets with her firm statements regarding the near-term prospects of ECB monetary policy, which would give the euro a positive impulse.
In this case, EUR/USD will attempt to correct after the fall, and a break above the resistance levels at 1.0650 (200 EMA on the 15-minute chart) and 1.0655 (today's high) will be the first signal for the resumption of long positions, with a break of the important short-term resistance level at 1.0677 (200 EMA on the 1-hour chart) confirming it.

After breaking through the resistance zone at levels 1.0790 and 1.0820 (144 EMA on the daily chart), EUR/USD will return to the medium-term bullish market zone.
However, only a break above the important long-term resistance levels at 1.1050 (200 EMA on the weekly chart) and 1.1090 (50 EMA on the monthly chart) will confirm the resumption of the long-term upward trend with the nearest targets near the resistance levels of 1.1275 (local resistance level), 1.1300 (upper line of the upward channel on the weekly chart), and further target near the resistance level of 1.1600 (200 EMA on the monthly chart).
Rising above the 1.1600 mark will indicate a return of EUR/USD to the global bullish market zone.
Support levels: 1.0615, 1.0600, 1.0530, 1.0500
Resistance levels: 1.0650, 1.0655, 1.0677, 1.0700, 1.0770, 1.0790, 1.0800, 1.0820, 1.0900, 1.0945, 1.1000, 1.1050, 1.1090, 1.1200, 1.1275, 1.1300, 1.1400, 1.1500, 1.1600
 English
 Русский
 Bahasa Indonesia
 Bahasa Malay
 ไทย
ไทย Español
 Deutsch
 Български
 Français
 Tiếng Việt
 中文
中文 বাংলা
বাংলা हिन्दी
 Čeština
 Українська
 Română

