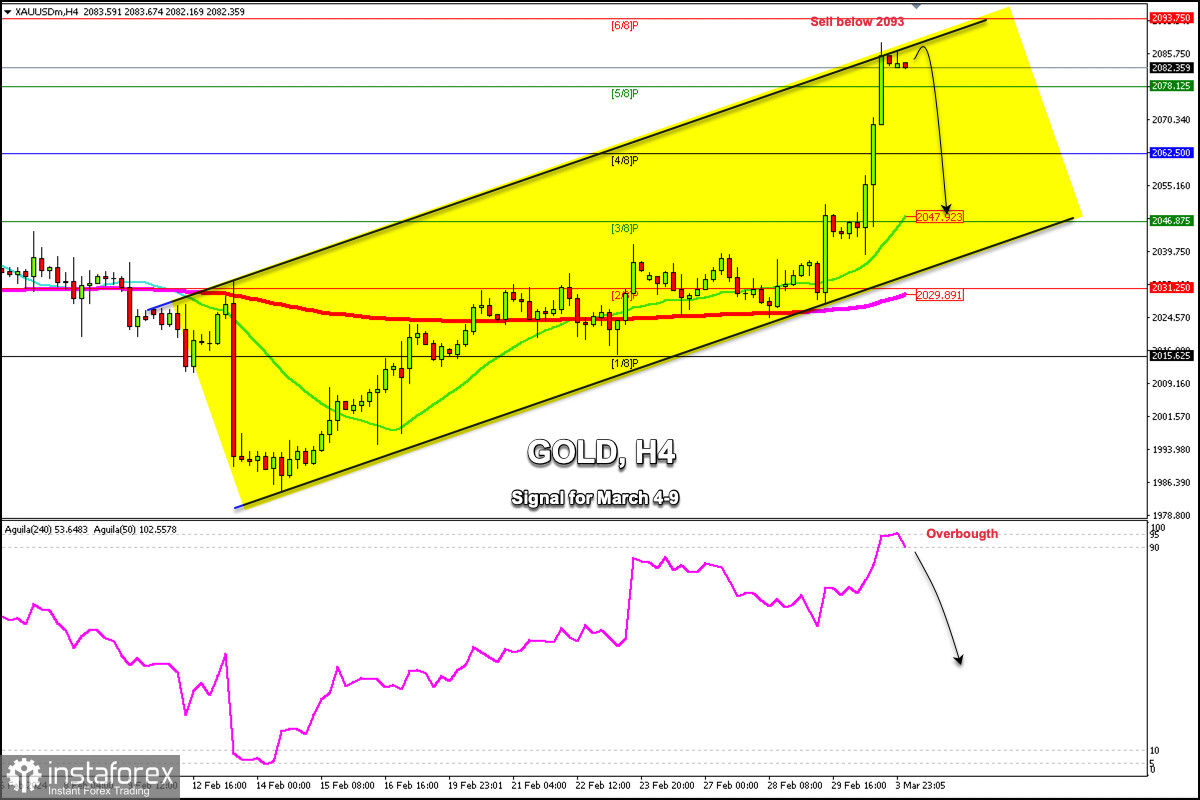
On Friday last week, gold reached a high of 2,088.31. It is currently trading around 2,082.35, retreating and showing signs of exhaustion.
The negative economic data from the United States caused a fall in the Treasury yields. This consequently favored gold, which quickly rose after breaking above 2,035 and reached the level of 2,088. Technically, a correction is expected in the coming days.
According to the H4 chart, gold appears strongly overbought. As it is settled below 6/8 Murray located at 2,093, any attempt to continue rising will be rejected as there is strong resistance around that area. The price is likely to fall and reach the 21 SMA located at 2,047 in the coming days.
In case gold attempts to break the top of the uptrend channel forming since February 14, we could expect a break of 2,090. If bullish strength prevails, the metal could face the strength and resistance of 6/8 Murray, located at 2,093.
According to the eagle indicator, gold is technically overbought. Hence, a technical correction below 2,093 is expected in the next few days. Then, we could sell below 2,093 with targets at 2,078, 2,062. Finally, we expect gold to reach 21 SMA located at 2,047.
On the contrary, if gold breaks and consolidates above 2,093 in the coming days, we should avoid selling. If this scenario occurs, the instrument could start a new bullish sequence and reach the high of November 26, 2023, at 2,144.
 English
 Русский
 Bahasa Indonesia
 Bahasa Malay
 ไทย
ไทย Español
 Deutsch
 Български
 Français
 Tiếng Việt
 中文
中文 বাংলা
বাংলা हिन्दी
 Čeština
 Українська
 Română

