EUR/USD

Higher Timeframes
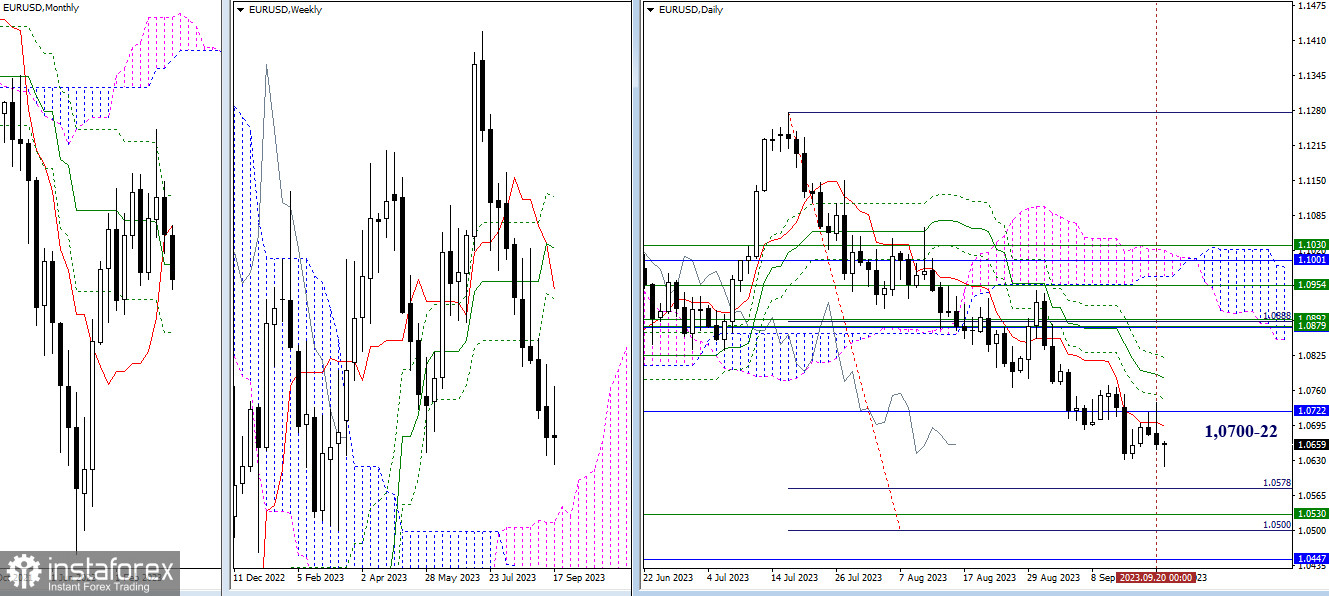
Yesterday, the pair once again tested the levels of 1.0700 - 1.0722 (daily short-term trend + monthly medium-term trend) and formed another more pronounced daily rebound from the encountered resistances. Now, it is crucial to see if the bears can develop rebound potential and implement further decline. The nearest support zone still consists of levels from various timeframes, situated at 1.0578 - 1.0530 - 1.0500 - 1.0447.

H4 - H1
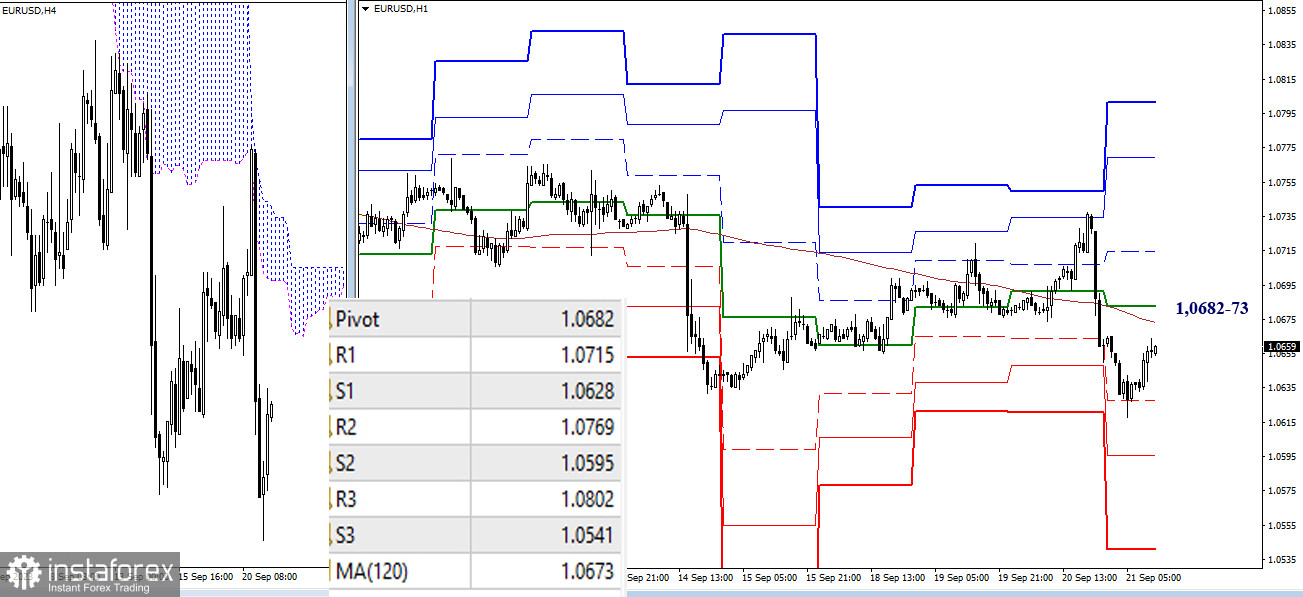
After establishing a daily rebound, the pair regained its bearish advantage on the lower timeframes. Today, the first support of classic pivot points (1.0628) has already been tested; further support can be provided by S2 (1.0595) and S3 (1.0541) during a decline. However, if the current correction allows bulls to build and restore their positions, then surpassing the key levels of 1.0673–82 (weekly long-term trend + central pivot point of the day), they can focus their attention on the resistances of classic pivot points (1.0715 - 1.0769 - 1.0802).
***
GBP/USD

Higher Timeframes
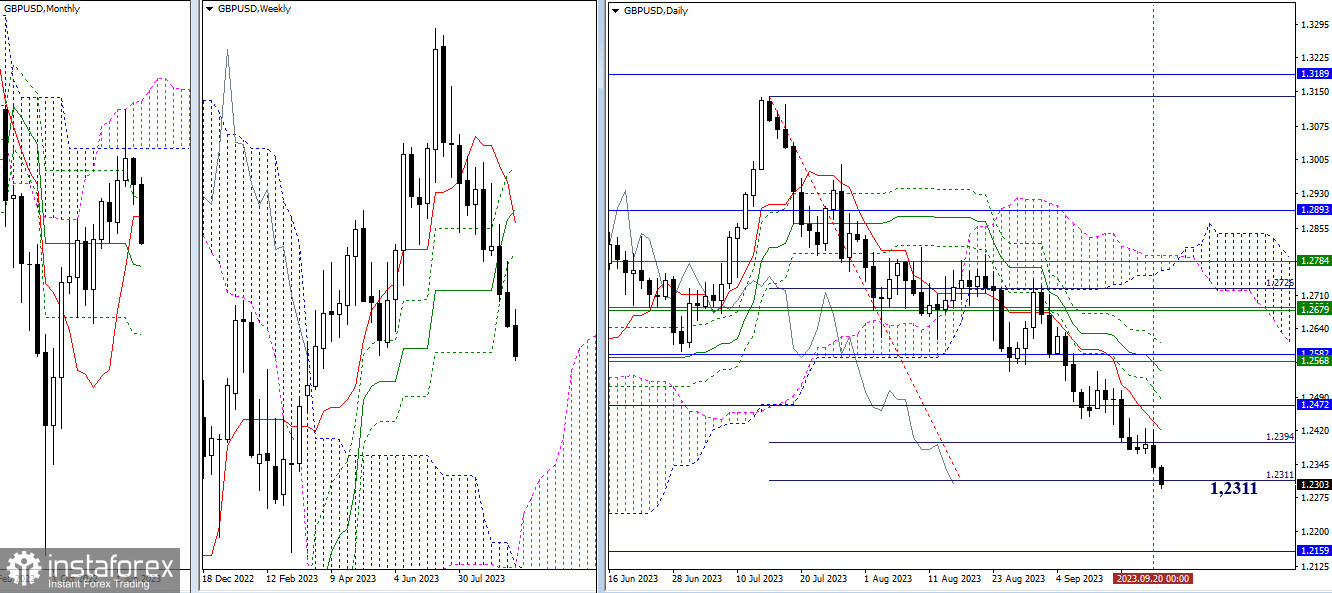
The pound continues to decline, and as result, today, the target for breaking through the daily Ichimoku cloud has already been achieved 100% (1.2311). A slowdown is now possible. If bearish players leave the target behind and continue the decline, their next target will be the support of the monthly medium-term trend (1.2159).

H4 - H1
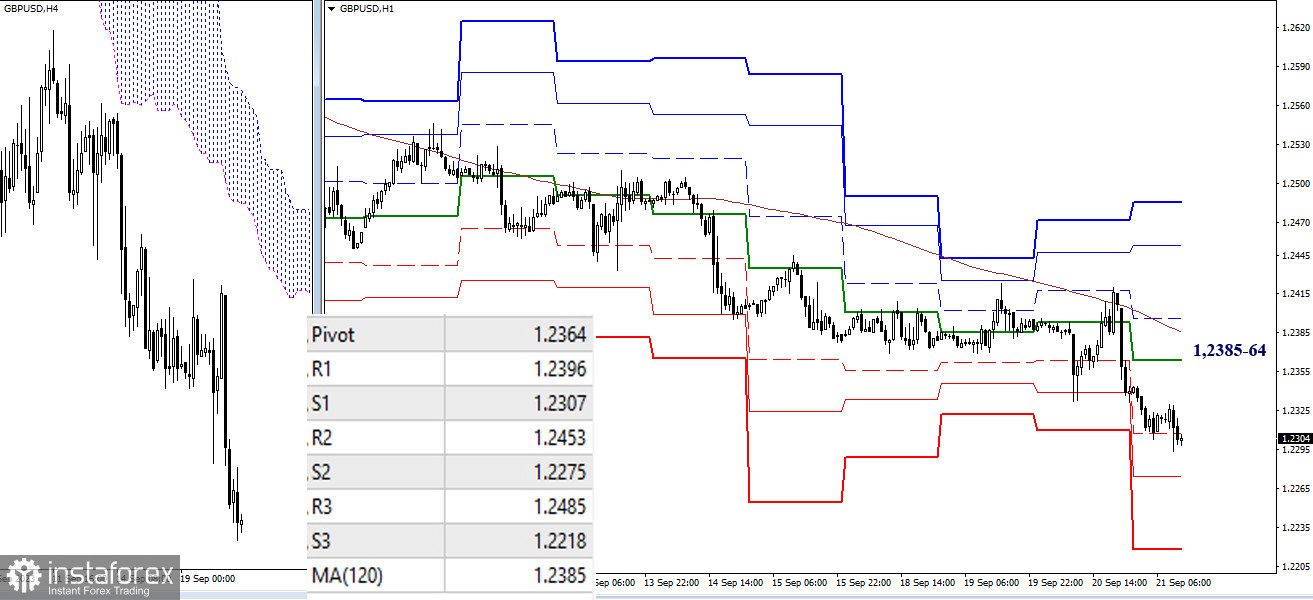
On the lower timeframes, we observe the development of a downward trend. After passing the first support (1.2307), intraday interest may be directed towards the remaining supports of classic pivot points (1.2275 - 1.2218). A change in sentiments and priorities could return the pair to key levels, currently located around 1.2385–64 (weekly long-term trend + central pivot point of the day). Consolidation above and a reversal of the moving average will allow for considerations of testing the resistances of classic pivot points (1.2396 - 1.2453 - 1.2485).
***
The technical analysis of the situation uses:
Higher timeframes - Ichimoku Kinko Hyo (9.26.52) + Fibo Kijun levels
Lower timeframes - H1 - Pivot Points (classic) + Moving Average 120 (weekly long-term trend)
 English
 Русский
 Bahasa Indonesia
 Bahasa Malay
 ไทย
ไทย Español
 Deutsch
 Български
 Français
 Tiếng Việt
 中文
中文 বাংলা
বাংলা हिन्दी
 Čeština
 Українська
 Română

