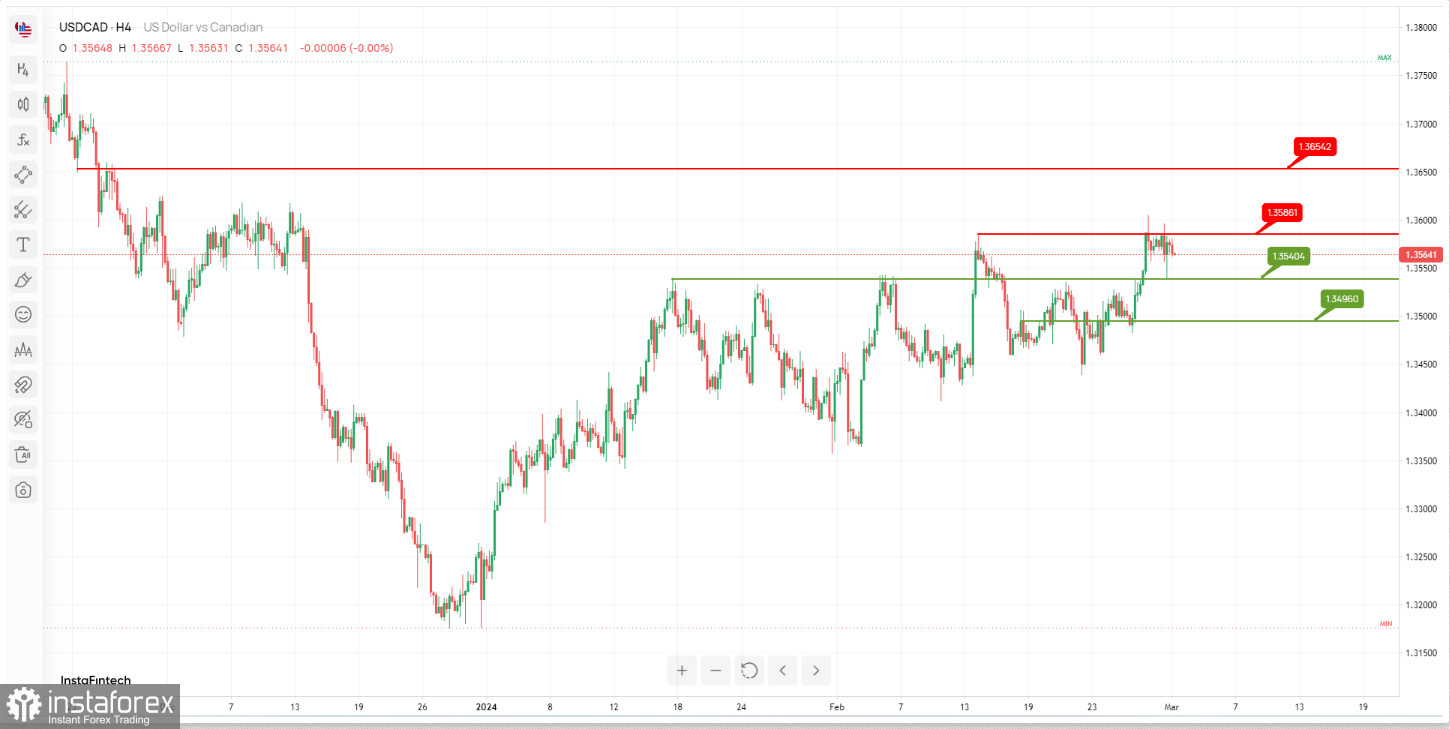
USD/CAD: here's the analysis for a potential bearish reversal:
Description: The chart suggests a potential bearish reversal, with significant support and resistance levels identified.
Resistance Levels:
The 1st resistance level is at 1.3586, characterized as "Multi-swing high resistance." This level indicates a historical area where the price has faced selling pressure, possibly due to multiple swing highs forming in this region.
The 2nd resistance level is located at 1.3654, marked as "An Overlap resistance." This level represents another significant historical area where the price has encountered resistance.
Support Levels:
The 1st support level is observed at 1.3540, identified as "An Overlap support." This level suggests a historical area where the price has found support.
The 2nd support level is identified at 1.3496, marked as "An Overlap support." This level represents another historical area where the price has found support.

 English
 Русский
 Bahasa Indonesia
 Bahasa Malay
 ไทย
ไทย Español
 Deutsch
 Български
 Français
 Tiếng Việt
 中文
中文 বাংলা
বাংলা हिन्दी
 Čeština
 Українська
 Română

