EUR/USD

Higher Timeframes
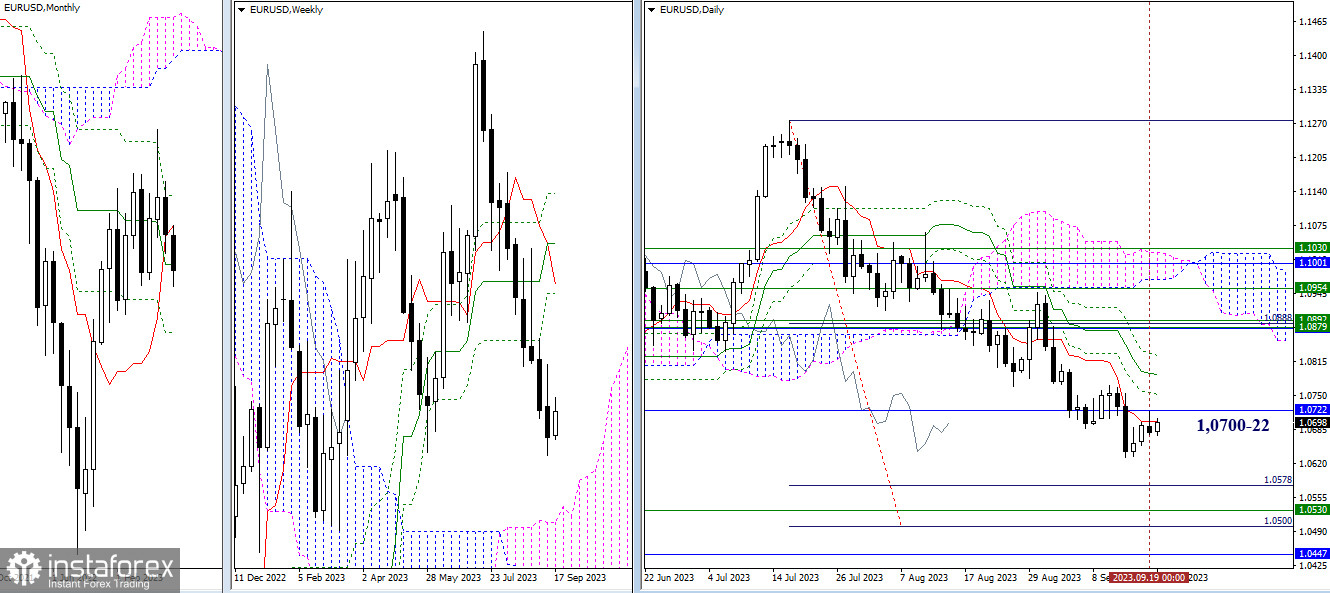
Euro retested the previously passed levels and currently remains within their influence zone. As of writing, two strong resistances are exerting their attraction: 1.0700 - 1.0722 (daily short-term trend + monthly medium-term trend). Consolidation above this range will open up opportunities for the development of the correction, with the next target for bullish players being the test of Ichimoku's daily death cross levels (1.0752 - 1.0789 - 1.0826). To pave the way for new prospects in the future, the daily cross needs to be eliminated. In case the upward correction concludes and the downward trend continues, the market's attention will shift towards the support zone at 1.0578 - 1.0530 - 1.0500 - 1.0447, where targets of various timeframes are gathered.

H4 - H1
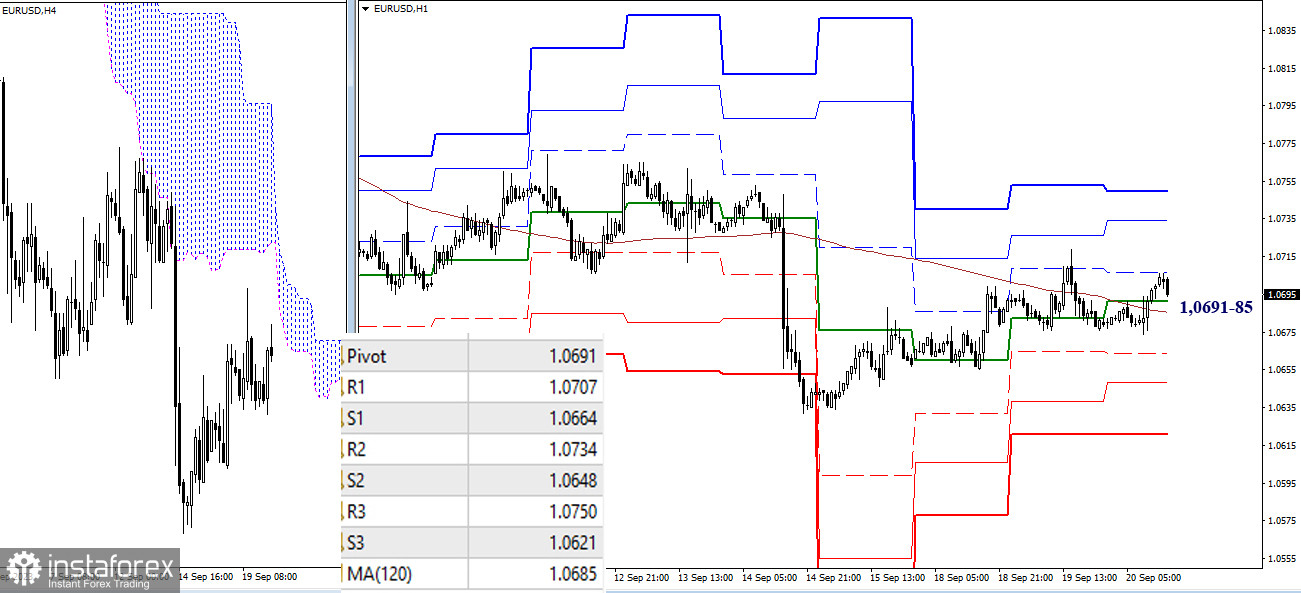
On the lower timeframes, the pair continues to trade around key levels that have joined forces today at the 1.0691–85 border (central pivot point of the day + weekly long-term trend). The continuation of this movement will lead to testing of classic pivot points. For bullish players, the key levels are important, and they currently stand at 1.0707 - 1.0734 - 1.0750, while for bearish players, the significance lies in the supports at 1.0664 - 1.0648 - 1.0621.
***
GBP/USD

Higher Timeframes
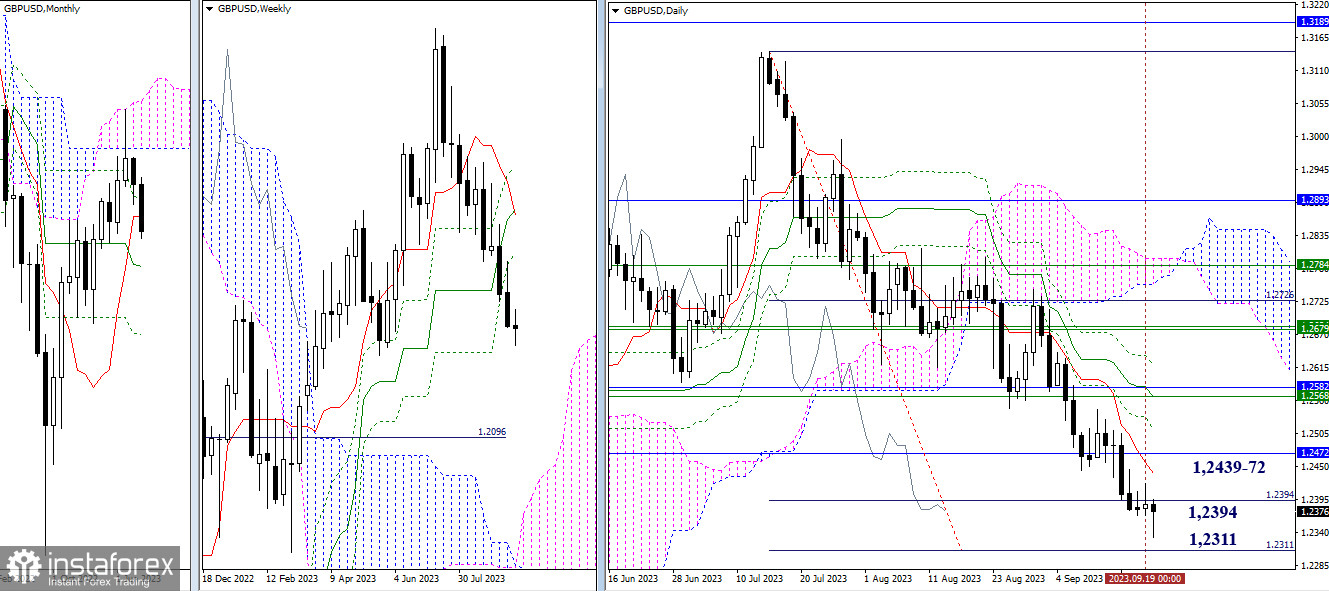
In the current conditions, bearish players seek to reach and fully work out the daily target for breaking through the Ichimoku cloud (1.2311). At present, the attraction and influence on the situation is exerted by the first target point of the daily target (1.2394). If the bears fail, then with the development of an upward correction, the first resistances to come into play will be at 1.2439 (daily short-term trend) and 1.2472 (monthly short-term trend).

H4 - H1
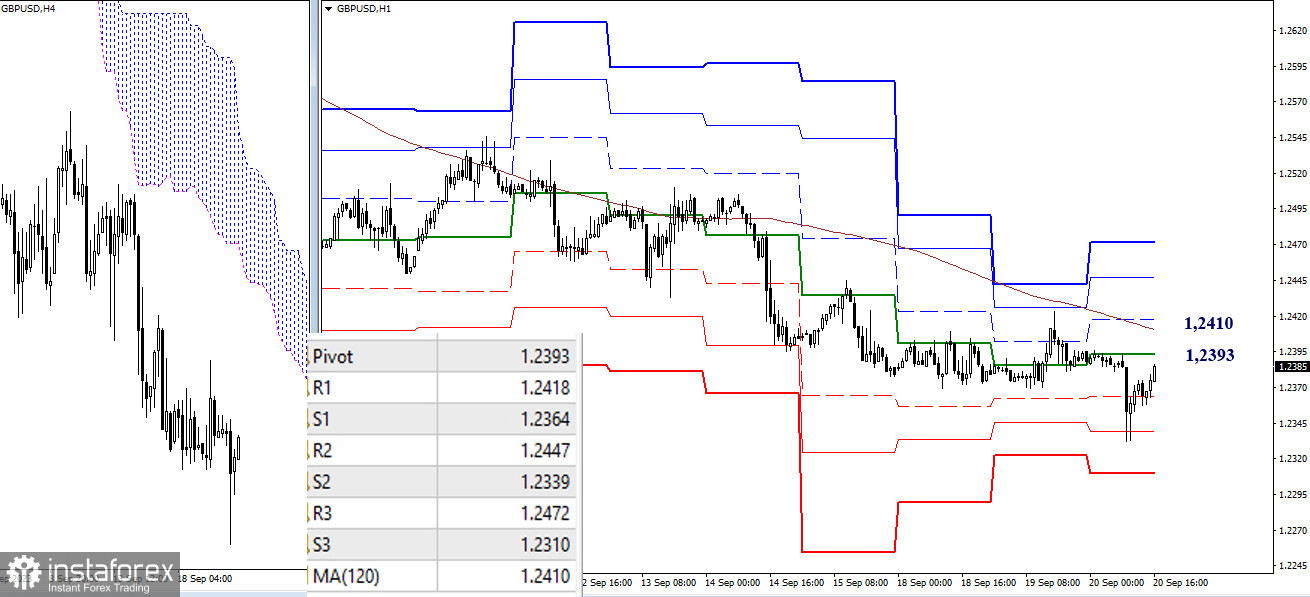
On the lower timeframes, bearish players maintain their advantage. Today, they continued the downward trend, but we are currently witnessing the development of another corrective rise. Key levels currently serve as correction benchmarks, concentrating resistances around the 1.2393 (central pivot point of the day) and 1.2410 (weekly long-term trend) borders. Consolidation above this levels can change the current balance of power. Next, attention will be directed towards breaking through the resistances of classic pivot points (1.2418 - 1.2447 - 1.2472). If the correction loses momentum, then to restore bearish sentiment today, it will be necessary to overcome the supports of classic pivot points (1.2364 - 1.2339 - 1.2310).
***
The technical analysis of the situation uses:
Higher timeframes - Ichimoku Kinko Hyo (9.26.52) + Fibo Kijun levels
Lower timeframes - H1 - Pivot Points (classic) + Moving Average 120 (weekly long-term trend)
 English
 Русский
 Bahasa Indonesia
 Bahasa Malay
 ไทย
ไทย Español
 Deutsch
 Български
 Français
 Tiếng Việt
 中文
中文 বাংলা
বাংলা हिन्दी
 Čeština
 Українська
 Română

