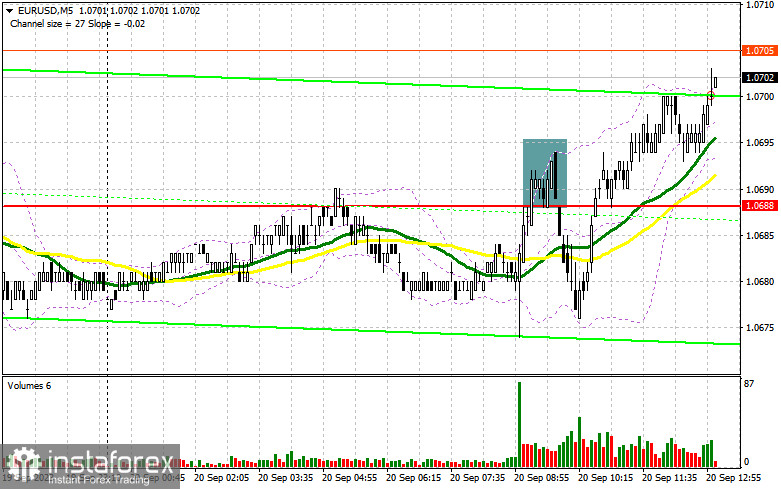
In my morning forecast, I drew attention to the level of 1.0688 and recommended making entry decisions based on it. Let's look at the 5-minute chart and analyze what happened there. The rise and the formation of a false breakout became a reason to sell the euro. However, after a 10-point drop, demand for risk assets returned, indicating the market's equilibrium ahead of the important Federal Reserve meeting. The technical picture was reassessed for the second half of the day.

To open long positions on EUR/USD, the following is required:
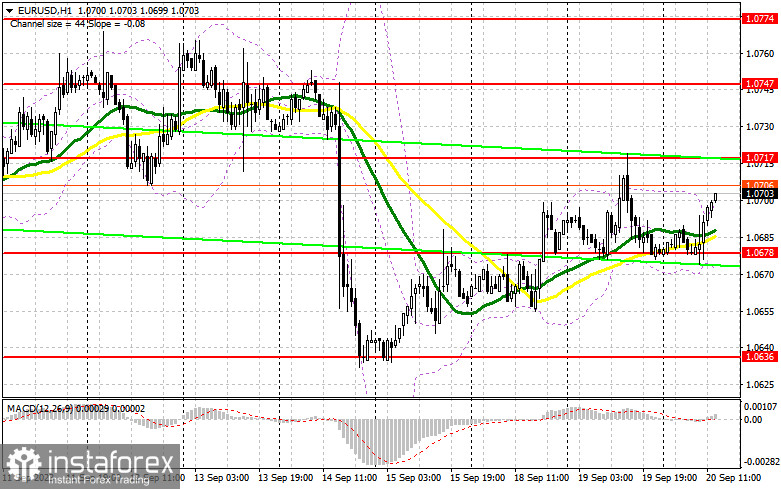
Considering the expected significant spike in volatility, there is no need to rush decision-making. Suppose the Federal Reserve keeps rates unchanged but revises its inflation forecasts for the next year upward and discusses a longer period of high-interest rates, as is quite obvious. In that case, demand for the dollar will return, and the pair will resume its decline. If the Fed's stance is more dovish, which is generally allowed by the recent data on US price growth, risk assets can perform well paired with the US dollar. This also applies to the European currency. I will only act on buying after a decline and the formation of a false breakout around the intermediate support level of 1.0678, formed during the first half of the day. Moving averages also pass through this level. Only such a setup and the Fed's dovish stance will lead to a sharp rise in the euro towards 1.0717. A breakthrough and a top-down test of this range will strengthen demand, giving a chance for a pair's correction towards 1.0747. The ultimate target will be the 1.0774 area, where I will take profit. In the case of EUR/USD decline and the absence of activity at 1.0678, which is more likely to be the case, bears will strengthen their control over the market. In this case, only the formation of a false breakout around the monthly low of 1.0636 will signal a euro purchase. I will open long positions after a rebound from 1.0598 with a 30-35 point upward correction target within the day.
To open short positions on EUR/USD, the following is required:
Sellers have also taken a wait-and-see position ahead of the important Federal Reserve meeting results and are not rushing back into the market. For this reason, I will monitor the entry point for short positions around 1.0717, where a false breakout will be an excellent signal for this, opening the way to the 1.0678 area, where moving averages that favor bulls pass through. A breakthrough and a bottom-up test of this level will create another sell signal with the prospect of a return to 1.0636. The ultimate target will be a new monthly low of 1.0598, where I will take profit. In the case of an upward movement of EUR/USD during the American session and the absence of bears at 1.0717, which will only happen after the Fed takes a soft stance, euro buyers will be able to regain the advantage and continue the pair's rise. In this scenario, I will postpone short positions until a new resistance level of 1.0747. You can sell there as well, but only after an unsuccessful breakout. I will open short positions immediately on a rebound from 1.0774, targeting a 30-35 point downward correction.

Indicator Signals:
Moving averages
Trading is taking place above the 30 and 50-day moving averages, indicating an upward movement of the pair.
Note: The period and prices of the moving averages discussed by the author are based on the hourly H1 chart and differ from the standard definition of classical daily moving averages on the daily D1 chart.
Bollinger Bands
In the case of an uptrend, the upper boundary of the indicator around 1.0700 will act as resistance.
Description of Indicators:
• Moving Average (determines the current trend by smoothing volatility and noise). Period 50. Marked in yellow on the chart.
• Moving Average (determines the current trend by smoothing volatility and noise). Period 30. Marked in green on the chart.
• MACD Indicator (Moving Average Convergence/Divergence – convergence/divergence of moving averages). Fast EMA period 12. Slow EMA period 26. SMA period 9.
• Bollinger Bands. Period 20.
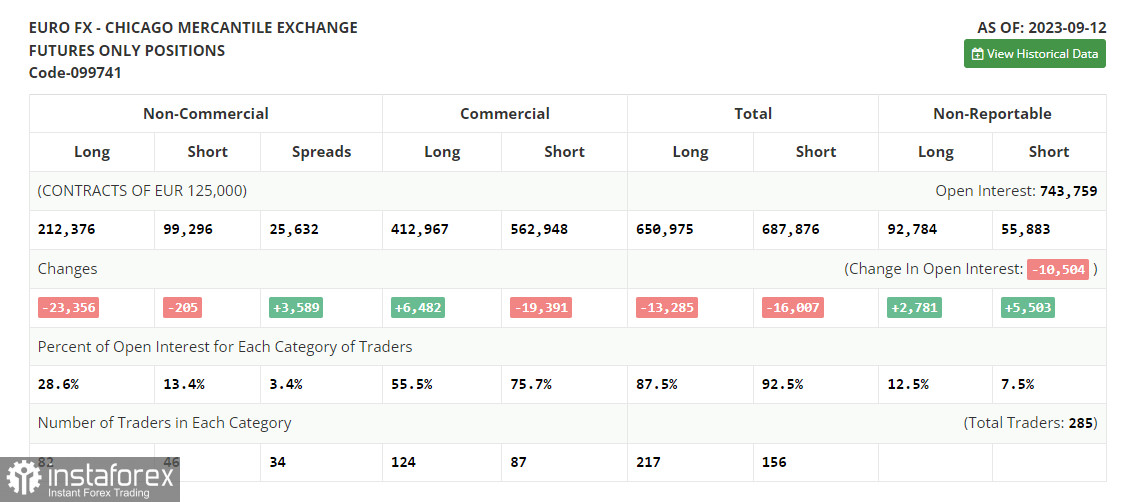
• Non-commercial traders - speculators, such as individual traders, hedge funds, and large institutions using the futures market for speculative purposes and meeting specific requirements.
• Long non-commercial positions represent the total long open positions of non-commercial traders.
• Short non-commercial positions represent the total short open positions of non-commercial traders.
• The total non-commercial net position is the difference between short and long positions of non-commercial traders.
 English
 Русский
 Bahasa Indonesia
 Bahasa Malay
 ไทย
ไทย Español
 Deutsch
 Български
 Français
 Tiếng Việt
 中文
中文 বাংলা
বাংলা हिन्दी
 Čeština
 Українська
 Română

