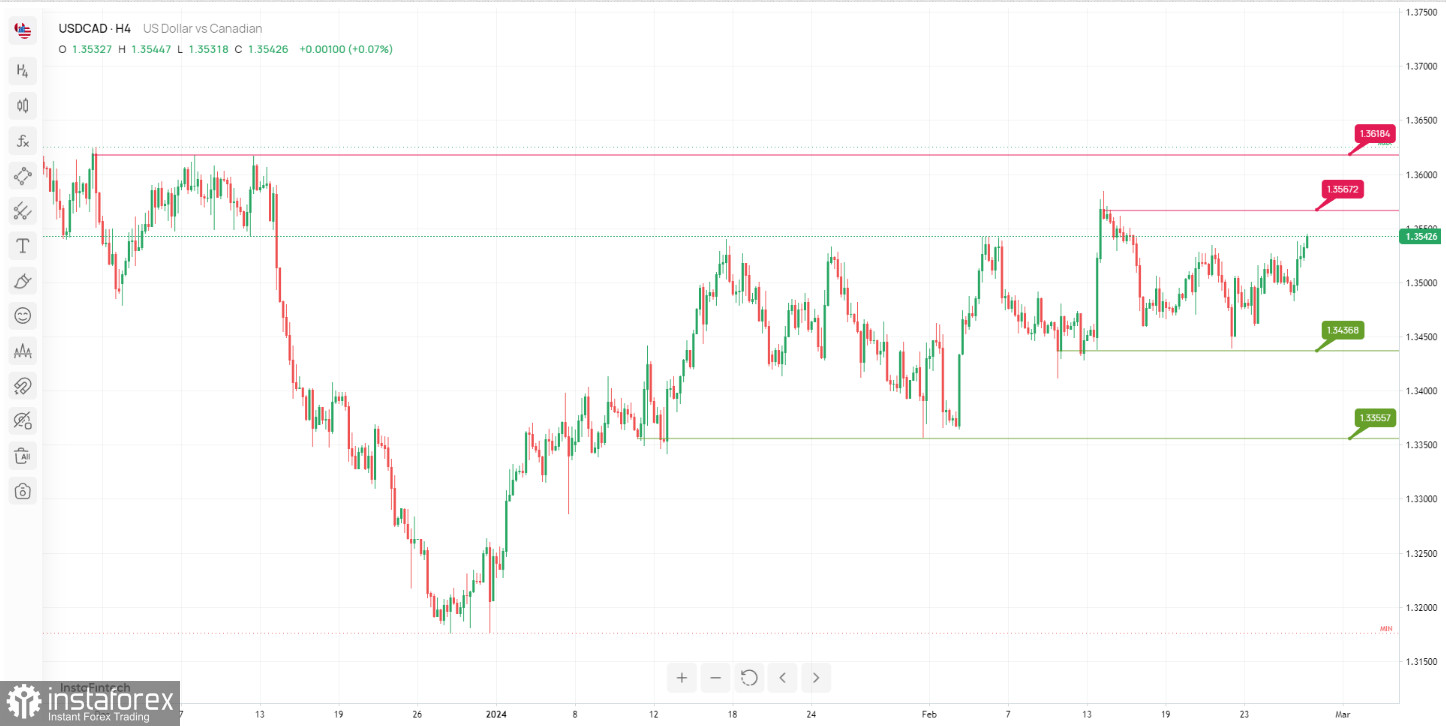
For USD/CAD, the potential bullish momentum scenario is as follows:
Description: The chart indicates a strong bullish momentum, with significant resistance identified at two levels.
Resistance Levels:
The 1st resistance level is observed at 1.3567, designated as a "Pullback resistance." This level indicates a historical barrier where the price has encountered selling pressure after reaching previous highs.
The 2nd resistance level is located at 1.3618, recognized as a "Pullback resistance." Like the 1st resistance, it represents another historical level where the price has struggled to move above due to selling pressure.
Support Levels:
The 1st support level is at 1.3436, characterized by a "Pullback support." This level suggests a historical area where the price has found support, coinciding with previous price action.
The 2nd support level is positioned at 1.3355, noted as a "Pullback support." This level represents another historical zone where price has found support, indicating potential buying interest.

 English
 Русский
 Bahasa Indonesia
 Bahasa Malay
 ไทย
ไทย Español
 Deutsch
 Български
 Français
 Tiếng Việt
 中文
中文 বাংলা
বাংলা हिन्दी
 Čeština
 Українська
 Română

