EUR/USD:
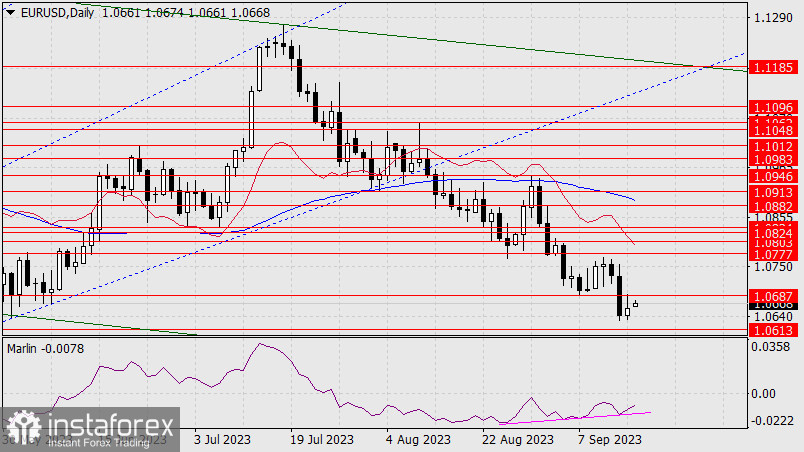
Last Friday, the euro edged up, reaching the upper shadow at the level of 1.0687, which is the low from September 7th. We are confirming the double convergence between the price and the Marlin oscillator, which is already a technical hint at a possible softening of the Federal Reserve's monetary policy. If we see such a signal on Wednesday, the euro could substantially rise, with the price breaking above the MACD line on the daily chart (above 1.0913).

However, we are concerned about the stock market – based on technical indicators, it is ready to decline, particularly the S&P 500, which could easily pull down the euro. The first target in the S&P 500 decline is 4325 (-2.82%). A rapid decline could easily pull the euro with it. The second significant target in the S&P 500 decline is 4200, which was the peak in January 2023.
If the Fed does not send any signals that it is ready to soften its stance, the euro could fall below 1.0613, breaking the double convergence, and then the price would head towards the lower Fibonacci ray line, the price channel line, and the support at 1.0483.

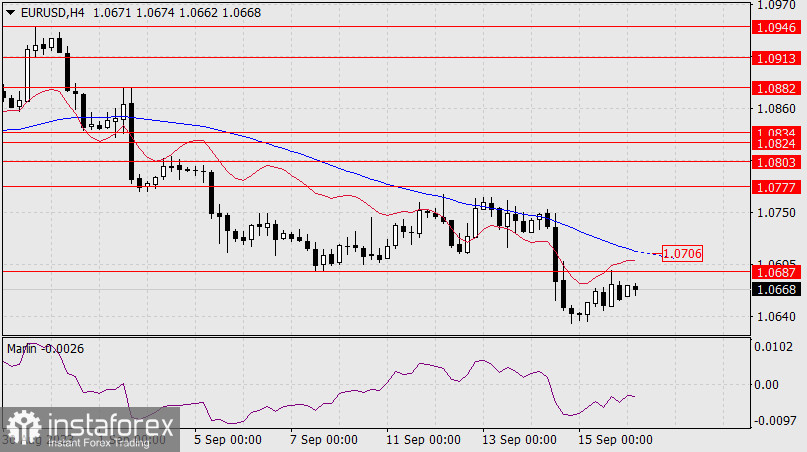
On the 4-hour chart, the price is consolidating below the level of 1.0687, and the Marlin oscillator is approaching the border of the uptrend territory. Synchronous movement with the price climbing above the resistance and the oscillator into the positive territory could push the price to rise further. The price would need to consolidate above the MACD line (1.0706). We're waiting for the results of the Fed meeting on Wednesday.
 English
 Русский
 Bahasa Indonesia
 Bahasa Malay
 ไทย
ไทย Español
 Deutsch
 Български
 Français
 Tiếng Việt
 中文
中文 বাংলা
বাংলা हिन्दी
 Čeština
 Українська
 Română

