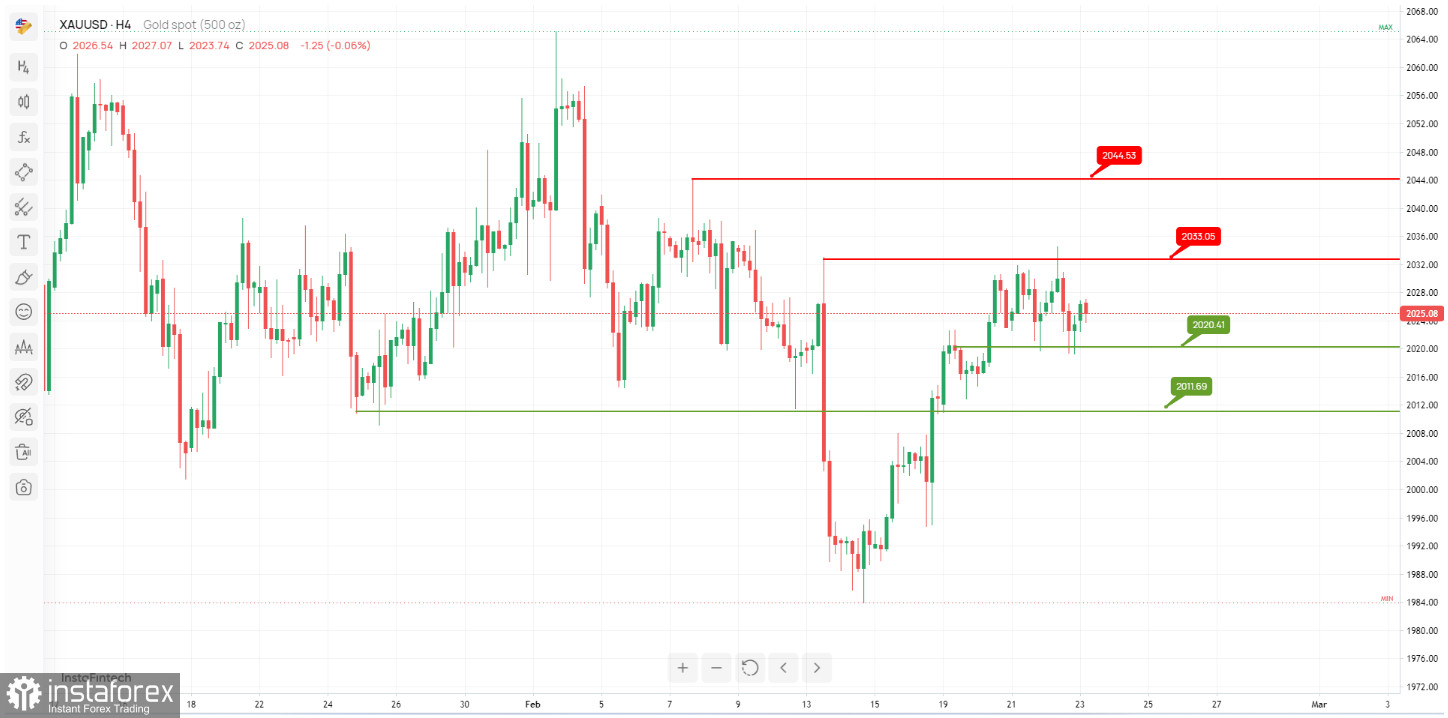
The XAU/USD, the potential neutral scenario is as follows:
Description: The chart suggests a neutral outlook, indicating a fluctuation between the 1st resistance and 1st support levels.
Support Levels:
The 1st support level is identified at 2020.41, characterized by "An Overlap support." This level represents a historical area where price has found support in the past.
The 2nd support level is positioned at 2011.69, noted as "An Overlap support." Similar to the 1st support level, it signifies another historical support zone.
Resistance Levels:
The 1st resistance level is observed at 2033.05, designated as "Swing high resistance." This level indicates a historical barrier where price has encountered selling pressure after reaching previous swing highs.
The 2nd resistance level is located at 2044.53, recognized as "Swing high resistance." Like the 1st resistance, it represents another historical level where price has struggled to move above due to selling pressure.
 English
 Русский
 Bahasa Indonesia
 Bahasa Malay
 ไทย
ไทย Español
 Deutsch
 Български
 Français
 Tiếng Việt
 中文
中文 বাংলা
বাংলা हिन्दी
 Čeština
 Українська
 Română

