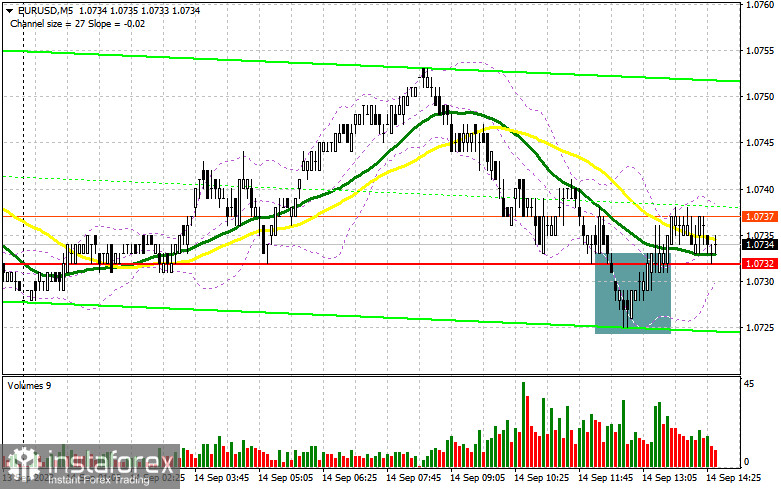
In my morning forecast, I highlighted the 1.0732 level and recommended making market entry decisions from that point. Let's look at the 5-minute chart and figure out what happened there. The decline and a false breakout at 1.0732 provided a buying signal for the euro. However, after a 7-point upward movement, demand weakened as all eyes were on the European Central Bank's monetary policy decision. The technical outlook remained unchanged for the afternoon.

What is needed to open long positions on EUR/USD
How to act and what to expect from the ECB's decision? Clearly, the regulator might consider raising rates. This will enable a surge in the euro against the US dollar. How long the bullish market will persist is a complicated question. Of course, the rate hike is bullish for the euro, but we shouldn't overlook the severe challenges which high interest rates present for the European economy. GDP is already on the verge of contraction, and business activity in both the services and manufacturing sectors has recently lost momentum. It's high time to consider the onset of a recession. If the ECB maintains its status quo and puts interest rates on hold, this would also signal a weakening of the euro.
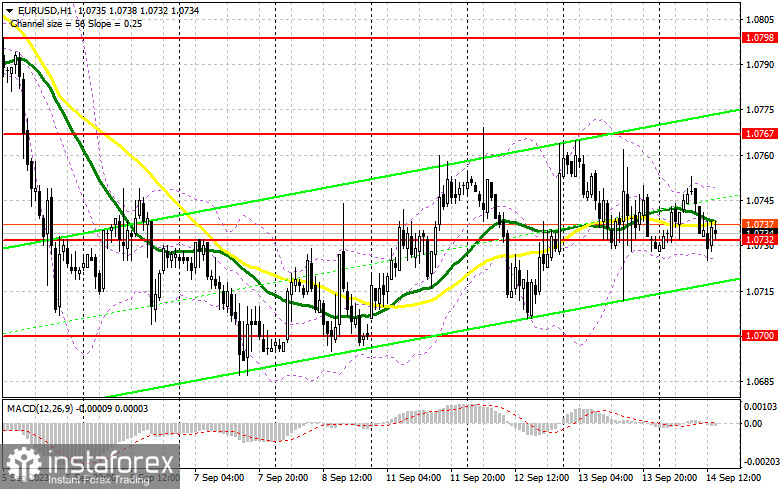
Given the expected burst of market volatility, I will enter the market only on a decline near the 1.0700 support level, where, in my opinion, buyers should emerge even amid dovish statements from Christine Lagarde. A false breakout at this level will confirm an appropriate entry point for long positions with the upward target at 1.0732, where the moving averages are currently passing and where the instrument is trading for the time being. Breaking and testing this area from the top-down will boost demand for the euro, providing a chance to surge to 1.0767. The highest target will be 1.0798, where I will lock in profits.
In a scenario of EUR/USD decline and inactivity at 1.0700, the bears will fully take market control. In such a case, only a false breakout around 1.0665 will signal long positions for the euro. I will open long positions immediately on a dip from 1.0637 bearing in mind an upward correction of 30-35 pips within the day.
What is needed to open short positions on EUR/USD
The bears have also taken a wait-and-see approach, focusing entirely on the ECB's decision. Should EUR/USD rise after a rate hike in the second half of the day, the bears will have to defend the 1.0767 resistance. A false breakout at this level will signal sell positions, opening the path towards the 1.0732 support level, where trading is currently taking place, and 1.0700. After a breakout and consolidation below this range, as well as a bottom-up retest, I anticipate another signal targeting 1.0665, which will indicate a resumption of the medium-term bearish trend. The ultimate target will be the 1.0637 area, where I will lock in profits. In case of an upward movement in EUR/USD during the American session and the inactivity of the bears at 1.0767, which could be possible if the ECB President maintains a hawkish stance on interest rates, the euro buyers will have a chance to enable an upward correction. In such a scenario, I will delay short positions until the new 1.0798 resistance. I can also sell there, but only after unsuccessful consolidation. I will open short positions immediately on a bounce from the 1.0825 high, aiming for a downward correction of 30-35 points.

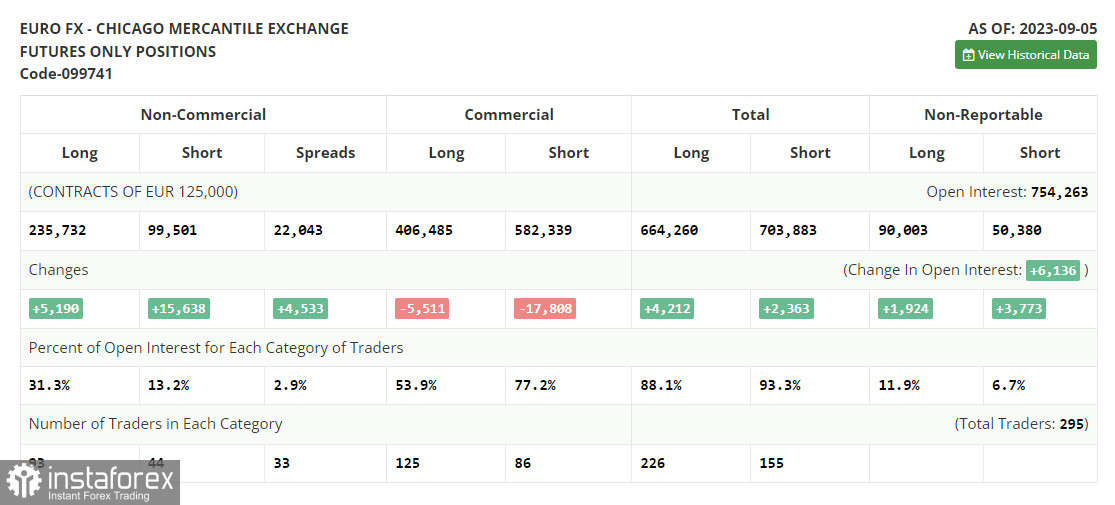
In the COT (Commitment of Traders) report for September 5th, there was an increase in both long and short positions. Significant negative changes in business activity in the eurozone, as well as the downward revision of the GDP for the second quarter, led to an increase in short positions for the trading instrument. Besides, Federal Reserve policymakers dropped a hint that interest rates might be raised again. Amid such fundamentals, it becomes clear why the dollar is asserting its strength while the European currency is declining. The US inflation figures released yesterday shed light on further monetary policy, inevitably impacting the direction of EUR/USD. Notably, amidst the decline in the euro's rate, long positions are increasing, indicating a significant interest from risk-asset buyers at such attractive prices.
The COT report shows that non-commercial long positions rose by 5,190 to 235,732, while non-commercial short positions jumped by 15,638 to 99,501. As a result, the spread between long and short positions increased by 4,533. EUR/USD closed last week lower at 1.0728 versus 1.0882 a week ago, indicating a bearish market.

Indicators' signals
Moving Averages
The instrument is trading slightly below the 30 and 50-day moving averages. It indicates that EUR/USD is expected to decline.
Note: The period and prices of the moving averages are considered by the analyst on the 1-hour chart and differ from the general definition of classic daily moving averages on the daily chart.
Bollinger Bands
In case EUR/USD goes up, the indicator's upper border at about 1.0745 will act as resistance.
Description of indicators
- Moving average (moving average, determines the current trend by smoothing out volatility and noise). Period 50. It is marked yellow on the chart.
- Moving average (moving average, determines the current trend by smoothing out volatility and noise). Period 30. It is marked green on the chart.
- MACD indicator (Moving Average Convergence/Divergence — convergence/divergence of moving averages) Quick EMA period 12. Slow EMA period to 26. SMA period 9
- Bollinger Bands (Bollinger Bands). Period 20
- Non-commercial speculative traders, such as individual traders, hedge funds, and large institutions that use the futures market for speculative purposes and meet certain requirements.
- Long non-commercial positions represent the total long open position of non-commercial traders.
- Short non-commercial positions represent the total short open position of non-commercial traders.
- Total non-commercial net position is the difference between short and long positions of non-commercial traders.
 English
 Русский
 Bahasa Indonesia
 Bahasa Malay
 ไทย
ไทย Español
 Deutsch
 Български
 Français
 Tiếng Việt
 中文
中文 বাংলা
বাংলা हिन्दी
 Čeština
 Українська
 Română

