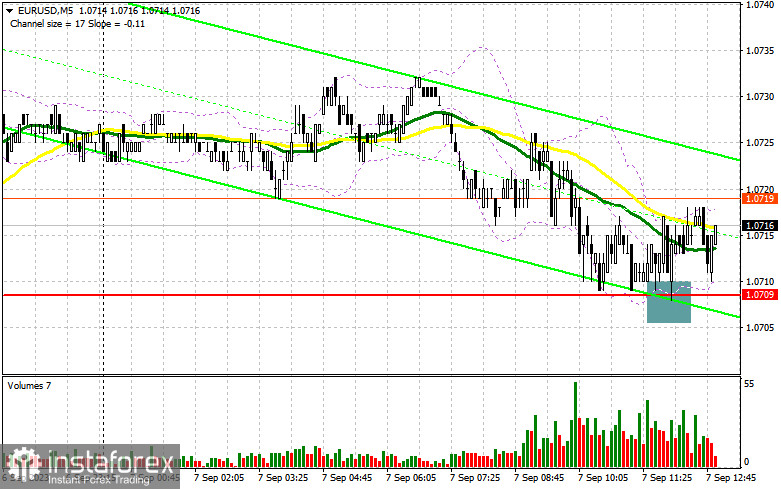
In my morning forecast, I emphasized the level of 1.0709 and recommended making trading decisions based on it. Let's look at the 5-minute chart and analyze what happened there. The decline and the formation of a false breakout near 1.0709 led to a buy signal for the euro, but due to weak statistics and a lack of demand for risk assets, this signal has yet to be realized. The technical picture for the second half of the day has stayed the same.

To open long positions on EUR/USD, it is required:
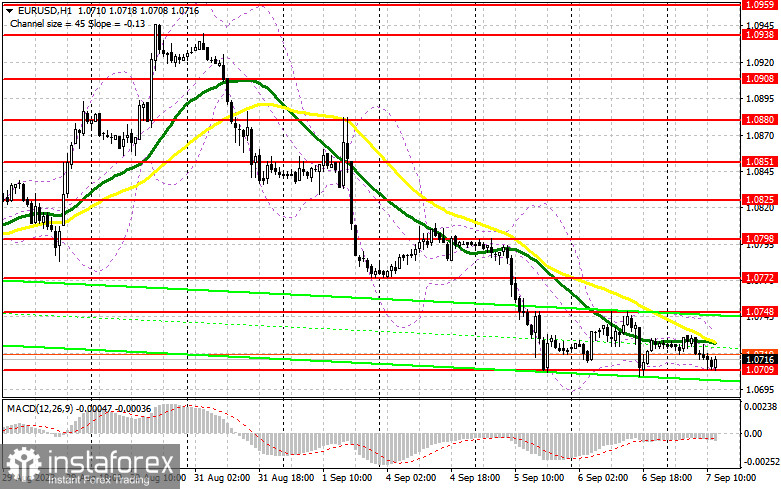
Data on Eurozone GDP for the 2nd quarter was revised downward immediately to 0.1%, from 0.3%, which does not add confidence to risk asset buyers. Considering that many economists are now confident that the European Central Bank will pause the interest rate hike cycle at the September meeting, the prospects for the recovery of the European currency, even after such a significant drop, are in doubt. As long as trading is above 1.0709, the chances of a correction remain, but once the bulls miss this level, the euro's decline will be unstoppable. The focus is now on the second half of the day and US statistics. Figures on the weekly number of initial jobless claims in the US are expected, which are unlikely to impact the balance of power strongly. More attention will be drawn to the speeches of FOMC members Patrick T. Harker, John Williams, and Michelle Bowman. The pair's decline will likely continue if policymakers take a tough stance even after recent US data.
Only a repeated false breakout formation at 1.0709 will confirm a suitable entry point for long positions to return to the 1.0748 area. A breakthrough and top-down testing of this range may occur quite quickly, as bears defended this level yesterday, and it's uncertain whether they will show up there again. Weak US statistics will boost demand for the euro, giving it a chance to jump to 1.0772. The ultimate target will be the 1.0798 area, where I will take profit. In the case of EUR/USD going down and the lack of activity at 1.0709 in the second half of the day, bears will retain control of the market. In this case, only a false breakout formation near 1.0669 will signal a buying opportunity for the euro. I will open long positions immediately on a rebound from 1.0637 with a target of a 30-35 point intraday upward trend.
To open short positions on EUR/USD, it is required:
Sellers are targeting 1.0709. However, much depends now on statements by American politicians. Dovish comments will surely lead to a surge in the pair, but only a false breakout at 1.0709 will provide a selling signal, opening the way back to the support area at 1.0709. Only after breaking and firmly establishing below this range and retesting from bottom to top do I expect to get another sell signal with a target of reaching 1.0669, where I anticipate the presence of larger buyers. The ultimate target will be the 1.0637 area, where I will take profit. In the case of upward movement of EUR/USD during the American session and the absence of bears at 1.0748, bulls will have a chance to build an uptrend against the bearish market. In this scenario, I will postpone short positions until a new resistance level of 1.0772. It's also possible to sell there, but only after an unsuccessful consolidation. I will open short positions immediately on a rebound from the maximum at 1.0798 with a target of a 30-35 point downward trend.

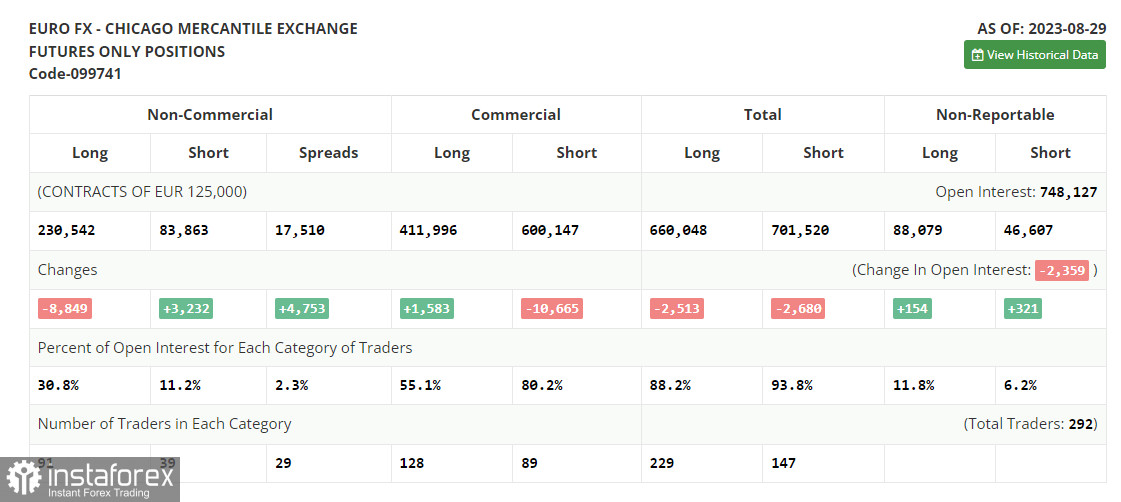
In the COT (Commitment of Traders) report for August 29th, long positions decreased, and short positions increased. Such market changes reflect hawkish comments from Fed Chairman Jerome Powell at the Jackson Hole symposium. Recent data on US personal consumption expenditures and the labor market convinced investors that the Fed would have to raise rates again, which kept the dollar attractive. However, paradoxically, the drop in the euro is quite an interesting moment, and buying risk assets on the dip remains the optimal medium-term strategy in the current conditions. According to the COT report, long non-commercial positions decreased by 8,849 to 230,542, while short non-commercial positions jumped by 3,232 to 83,863. As a result, the spread between long and short positions increased by 4,753. The closing price decreased to 1.0882 from 1.0866, indicating a bearish market.

Indicator signals:
Moving Averages
Trading is conducted below the 30 and 50-day moving averages, indicating a bearish market.
Note: The author considers the periods and prices of moving averages on the hourly H1 chart, which differ from the general definition of classical daily moving averages on the daily D1 chart.
Bollinger Bands
In case of an upward trend, the upper boundary of the indicator will act as resistance around 1.0709.
Description of Indicators:
• Moving Average (determines the current trend by smoothing volatility and noise). Period - 50. Marked in yellow on the chart.
• Moving Average (determines the current trend by smoothing volatility and noise). Period - 30. Marked in green on the chart.
• MACD Indicator (Moving Average Convergence/Divergence - convergence/divergence of moving averages) Fast EMA - period 12. Slow EMA - period 26. SMA - period 9.
• Bollinger Bands. Period - 20.
• Non-commercial traders - speculators, such as individual traders, hedge funds, and large institutions using the futures market for speculative purposes and meeting certain requirements.
• Long non-commercial positions represent the total long open positions of non-commercial traders.
• Short non-commercial positions represent the total short open positions of non-commercial traders.
• The total non-commercial net position is the difference between non-commercial traders' short and long positions.
 English
 Русский
 Bahasa Indonesia
 Bahasa Malay
 ไทย
ไทย Español
 Deutsch
 Български
 Français
 Tiếng Việt
 中文
中文 বাংলা
বাংলা हिन्दी
 Čeština
 Українська
 Română

