EUR/USD

Higher time frames:
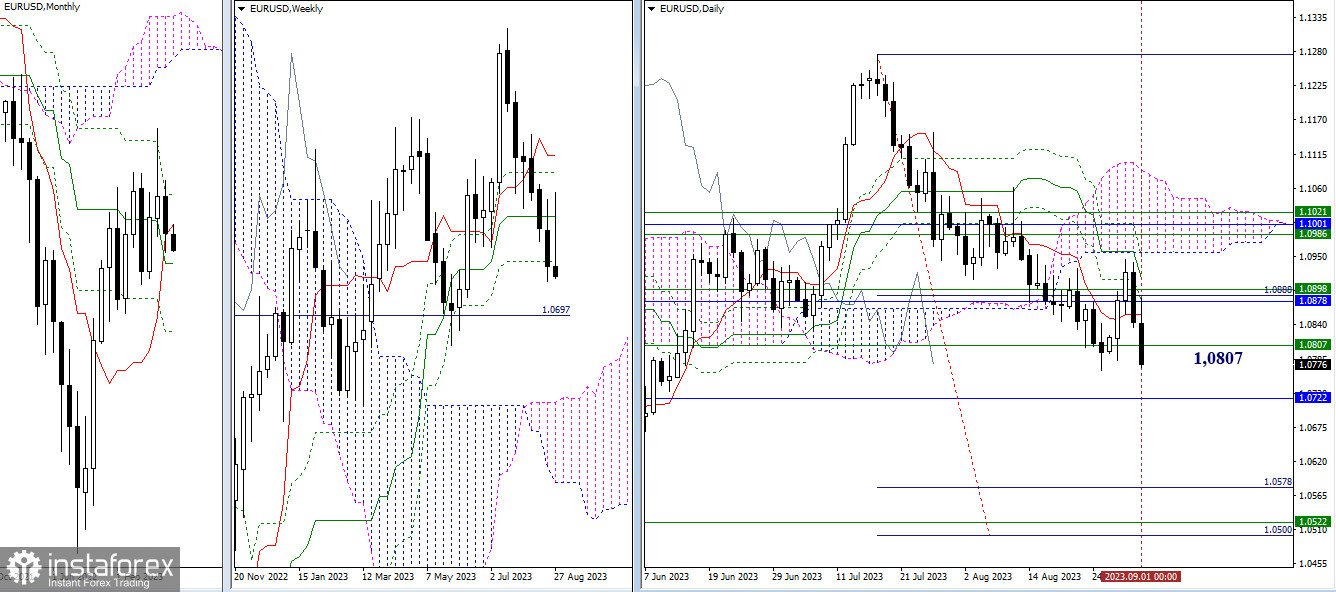
Last week marked the end of the last summer month. Bears could not claim a major part of the market due to the support of the monthly short-term trend. With the end of August, the Ichimoku indicator pattern changed, contributing to the effectiveness of the bearish momentum on Friday. Currently, reviving the low (1.0766), a break below the weekly Ichimoku cross (1.0807), and the continuation of the downtrend on the daily chart will open up new targets for the bears – 1.0722 (monthly medium-term trend) and 1.0500-22-78 (upper band of the weekly cloud + breakout target of the daily cloud). If bearish sentiment does not prevail in order for the pair to fall further, a pause around the weekly support area may help the bulls recover lost ground and start a new corrective rally. The nearest resistance zone, which is quite important at the moment, is the cluster of levels at 1.0878 – 1.0898 – 1.0914 (monthly short-term trend + weekly medium-term trend + daily medium-term trend). A solid breakthrough above this zone can reignite ambitions and prospects for an upward move.

4H – 1H:
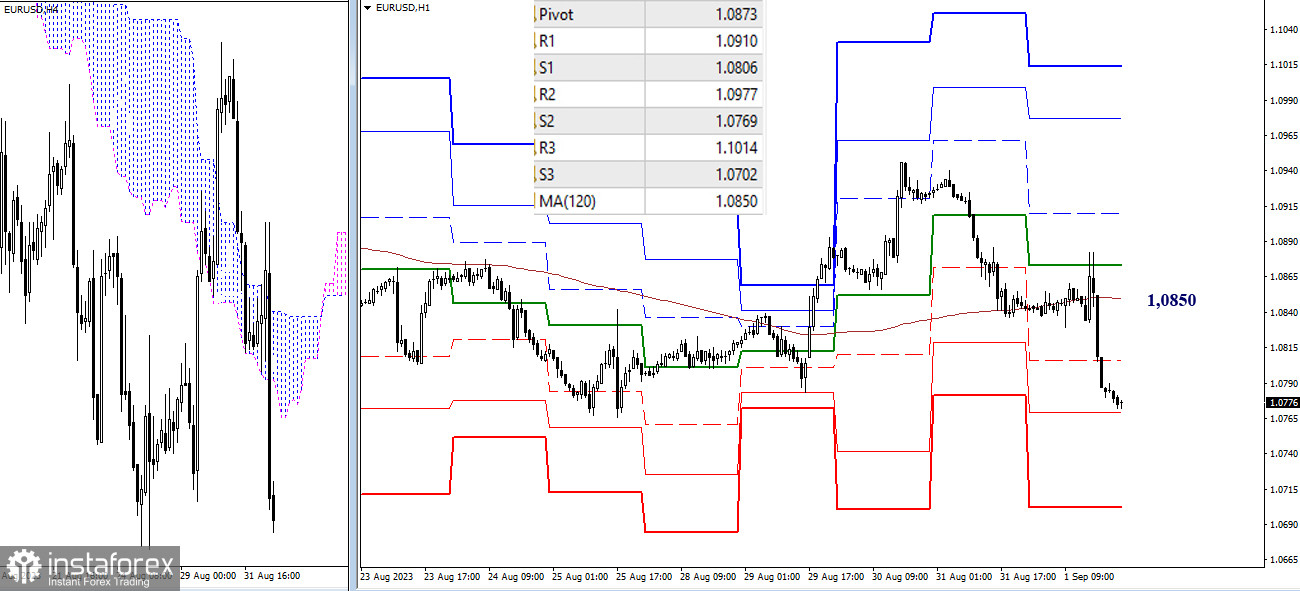
The bears managed to secure a victory in the battle for the weekly long-term trend on the last day of the week. As a result, they gained a significant advantage. The weekly long-term trend (1.0850) will likely maintain its position with the start of a new week, but it's advisable to reassess the positioning of other intraday marks on Monday. In order to build the downtrend, classical Pivot support levels will be of interest, while the classical Pivot resistance levels will be crucial for the bulls. They can regain the upper hand on the lower time frames by reclaiming the weekly long-term trend.
***
GBP/USD

Higher time frames:
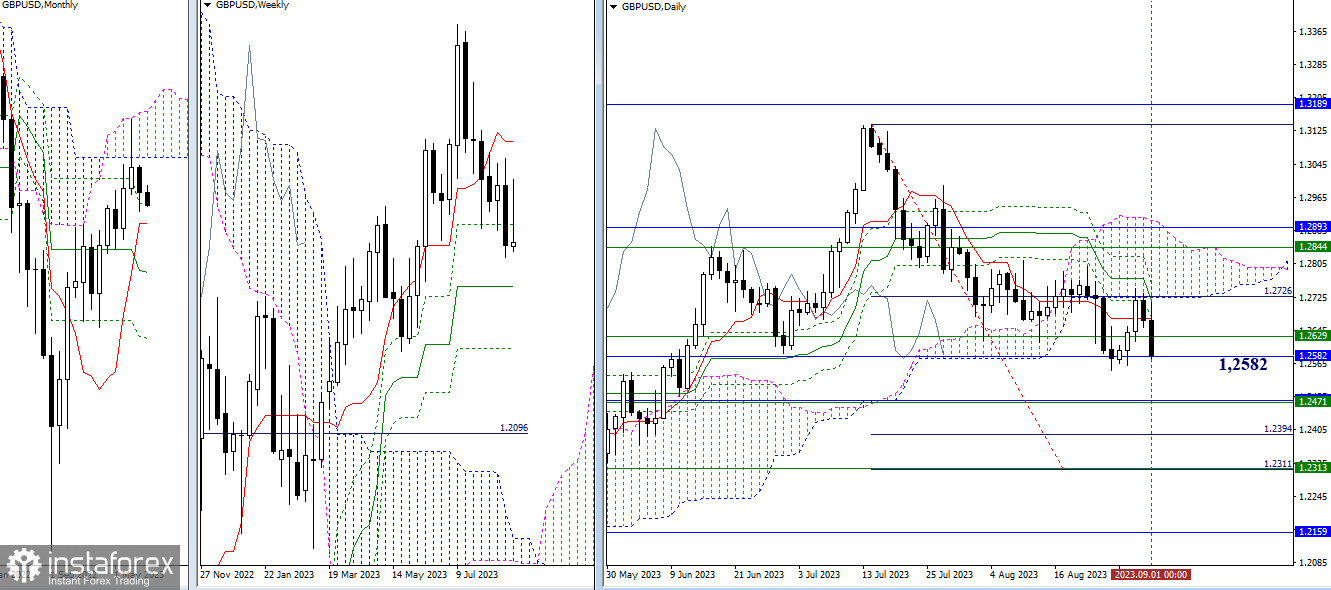
Bears gained an advantage from the closing of the previous week. They approached the low of the current correction (1.2547). The bears are now focused on updating and continuing the downtrend on the daily chart. Among the subsequent targets, we can take note of the level of 1.2471 (weekly medium-term trend + monthly short-term trend) and the zone of 1.2311-94 (breakout target of the daily cloud + final level of the weekly Golden Ichimoku cross). In the current situation, the influence of the nearest levels at 1.2582 (monthly Fib Kijun) and 1.2629 (weekly Fib Kijun) could impede the bears' plans.

4H – 1H:
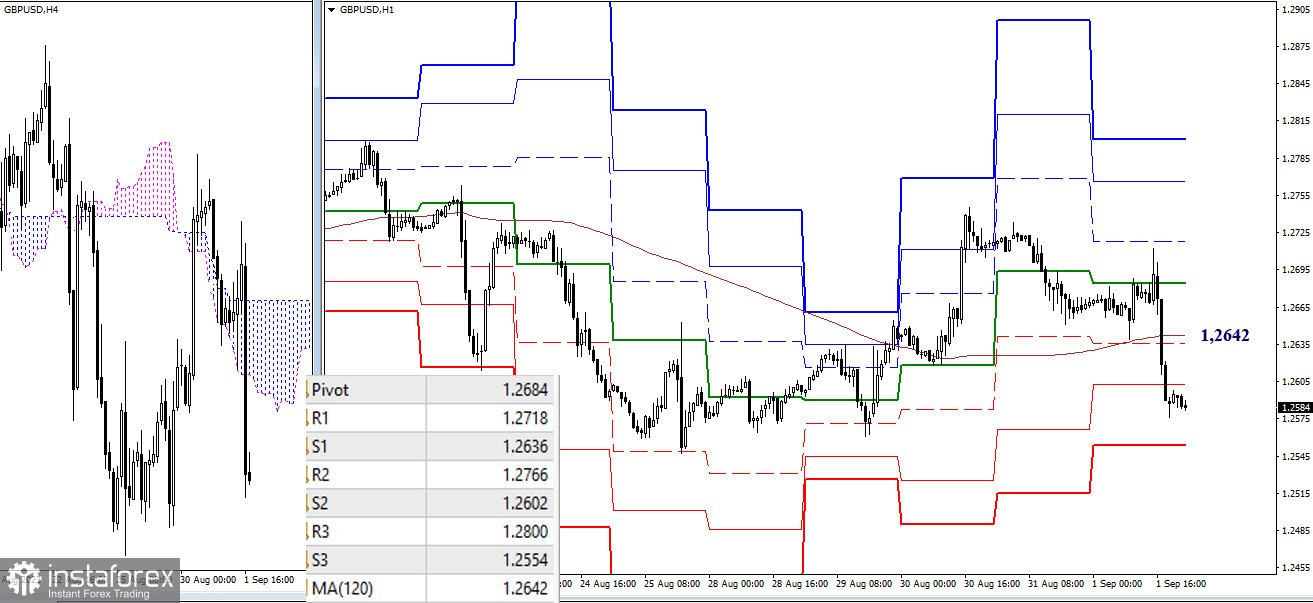
On Friday, the bears lost key support on the lower time frames. A solid break below the weekly long-term trend (1.2642) and a moving average reversal could shift the current balance of power in favor of strengthening the bearish sentiment. The intraday references are provided by the classical Pivot support and resistance levels. It's advisable to review their positioning with the start of the new trading week.
***
In order to analyze the situation, the following tools were used:
Higher time frames – Ichimoku Kinko Hyo (9.26.52) + Fib Kijun levels;
Lower time frames – 1H – Classic Pivot Points + Moving Average 120 (weekly long-term trend).
 English
 Русский
 Bahasa Indonesia
 Bahasa Malay
 ไทย
ไทย Español
 Deutsch
 Български
 Français
 Tiếng Việt
 中文
中文 বাংলা
বাংলা हिन्दी
 Čeština
 Українська
 Română

