Long-term perspective.

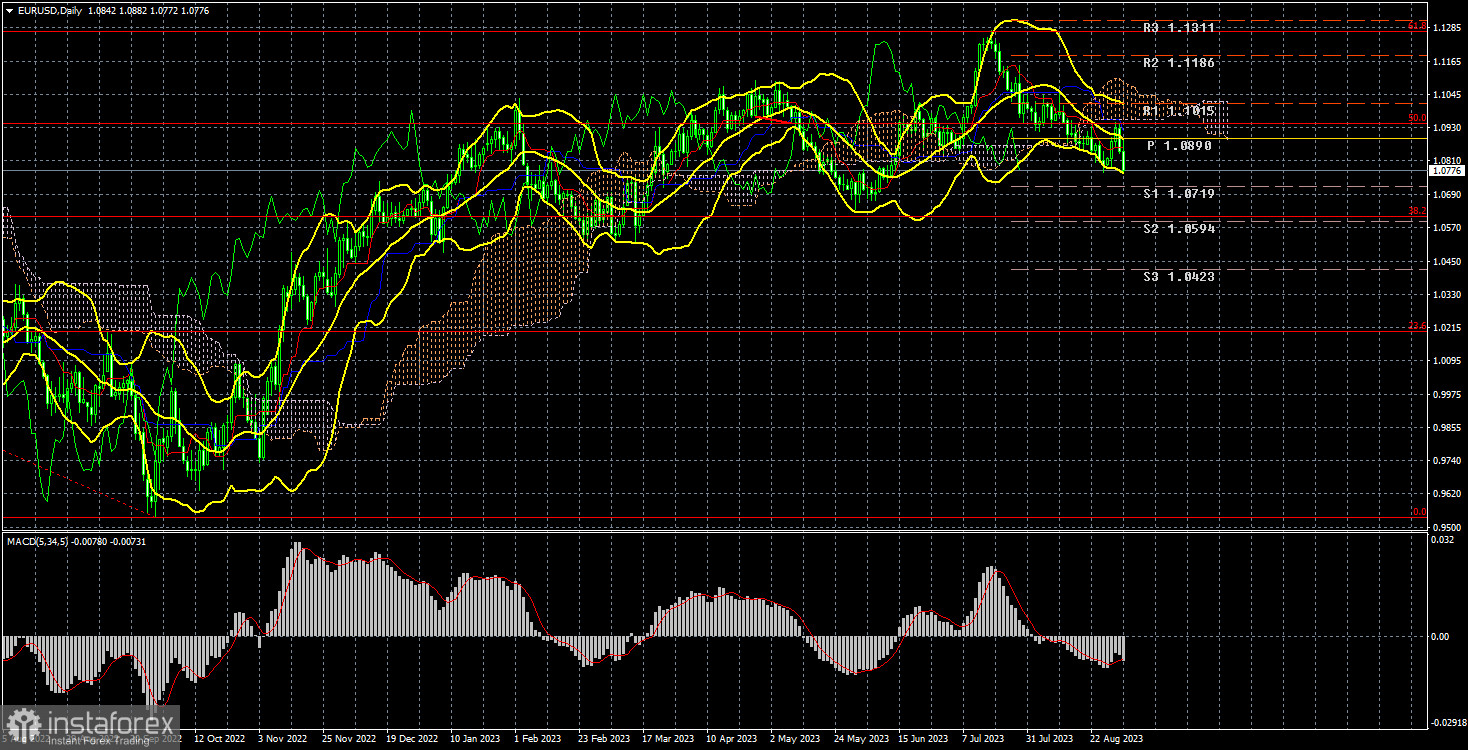
During the current week, the EUR/USD currency pair attempted to resume its upward movement, but it plummeted downward in the second half of the week. We have repeatedly discussed the overbought condition of the European currency and the highly likely conclusion of the upward trend. The euro cannot keep rising constantly without any basis. What happened this week requires careful analysis, so let's dive in.
At least three important reports from the United States were disappointing in the first half of the week. GDP growth in the second quarter was weaker than expected, the number of JOLTS job openings was significantly below forecasts, and the ADP report indicated fewer nonfarm payroll jobs were created. It seemed logical: weak American statistics, a falling dollar. However, on Thursday and Friday, things could have been more straightforward. While inflation data in the European Union can be interpreted differently, labor market and unemployment data in the United States also turned out to be relatively weak, but the dollar strengthened. And it strengthened more than it fell in the first three days of the week.
It is worth remembering that the ECB is getting closer to the end of its monetary policy tightening cycle while its interest rate is still far from the Fed's rate. In other words, the European regulator intends to conclude tightening prematurely and then hope for inflation to fall to 2% for several years naturally. The ECB has no other option because more significant interest rate hikes would trigger a recession in half of the Eurozone countries. Moving on, almost any strong reports from the EU are weaker than the worst reports from the United States. This is evident in GDP, inflation, or interest rate indicators. Therefore, no matter what statistics come out of the EU and the USA, the advantage remains with the dollar.
And if we recall that the dollar has been declining for 11 months, during which the Fed raised interest rates more strongly and quickly than the ECB, then the path for this pair remains one way—downward. We remind you that we have been questioning the further rise of the euro currency since the beginning of the year. The decline began much later, but it's better late than never.
COT Analysis.

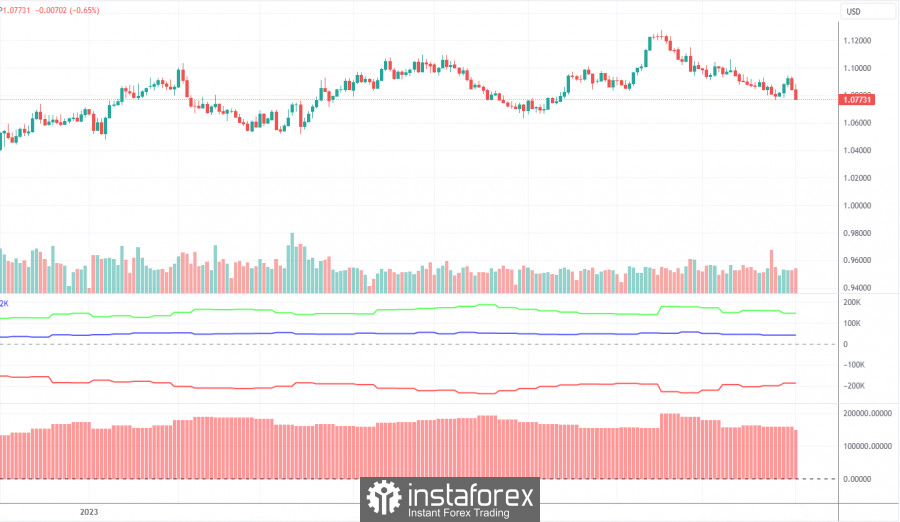
On Friday, a new COT report for August 29th was released. Over the past 11 months, the COT report data has fully reflected the market's dynamics. The net position of large players (the second indicator) started to rise in September 2022, around the same time the European currency began its ascent. The net position has hardly increased in the last 6-7 months, but the euro remains quite high and hardly declines. Currently, the net position of non-commercial traders is "bullish" and remains strong, while the European currency continues to stay strong against the dollar.
We have previously drawn traders' attention to the fact that a relatively high value of the "net position" suggests the possibility of the end of the upward trend. This is indicated by the first indicator, where the red and green lines have significantly diverged, often preceding the end of a trend. During the last reporting week, the number of buy contracts among the "Non-commercial" group decreased by 8.8 thousand, while the number of shorts increased by 3.2 thousand. Consequently, the net position decreased by 12.1 thousand contracts. The number of buy contracts is higher than that of sell contracts among non-commercial traders by 148 thousand, which is a significant gap, almost threefold. In principle, even without the COT reports, it is evident that the European currency should decline, but the market is still not rushing to sell.
Fundamental events overview:
There were a few fundamental events this week. All traders' attention was focused on macroeconomic events, and the latest data we still need to discuss are the Friday reports. Nonfarm Payrolls exceeded expectations by 17 thousand, and the previous value was revised downward by 30 thousand. The unemployment rate increased by 0.3% to 3.8%. The ISM Manufacturing Purchasing Managers' Index rose to 47.6 points, with a forecast of 47 (remaining below the 50.0 "waterline"). After the release of this data, the US dollar increased by 70 points. What does this indicate? Our perspective indicates that the market has turned "bearish." The euro has been rising for a long time without substantial reasons, and now it's time for a period of justice restoration.
Trading plan for the week of August 28th to September 1st:
- In the 24-hour timeframe, the pair tested the 61.8% Fibonacci level at 1.1270 and started a downward correction. This week, it bounced off the Senkou Span B line and the 50.0% Fibonacci level, resuming its decline. Therefore, there are currently no grounds for buying. The trend is likely to shift to "bearish," as expected in recent months.
- As for selling the euro/dollar pair, it currently appears more promising. The Ichimoku Cloud has been breached, so the decline may continue with the targets we mentioned several months ago - the 5th and 6th levels, which are close to reach. Additionally, the 38.2% Fibonacci level runs through that area, which will attract price action since it's significant. The decline may be gradual and not very strong, as volatility on lower timeframes remains low. Nevertheless, we still advocate for the euro's continued decline.
Explanations for the illustrations:
Price support and resistance levels, Fibonacci levels - these are the targets when opening buy or sell positions. You can place Take Profit levels near them.
Indicators used: Ichimoku (default settings), Bollinger Bands (default settings), MACD (5, 34, 5).
Indicator 1 on the COT charts - the size of the net position for each trader category.
Indicator 2 on the COT charts - the size of the net position for the "Non-commercial" group.
 English
 Русский
 Bahasa Indonesia
 Bahasa Malay
 ไทย
ไทย Español
 Deutsch
 Български
 Français
 Tiếng Việt
 中文
中文 বাংলা
বাংলা हिन्दी
 Čeština
 Українська
 Română

