 English
  Русский
 Bahasa Indonesia
 Bahasa Malay
 ไทย
ไทย Español
 Deutsch
 Български
 Français
 Tiếng Việt
 中文
中文 বাংলা
বাংলা हिन्दी
 Čeština
 Українська
 Română

In the previous forecast, I drew your attention to the level 1.0828 and recommended entering the market from this level. Let's have a look at the 5-minute chart and analyze the situation. The euro/dollar pair dropped and made a false breakout at 1.0828. This created a buy signal, resulting in a 30-point rise. Defending 1.0857 and the false breakout there resulted in a selling entry point, but a significant decline has not occurred yet.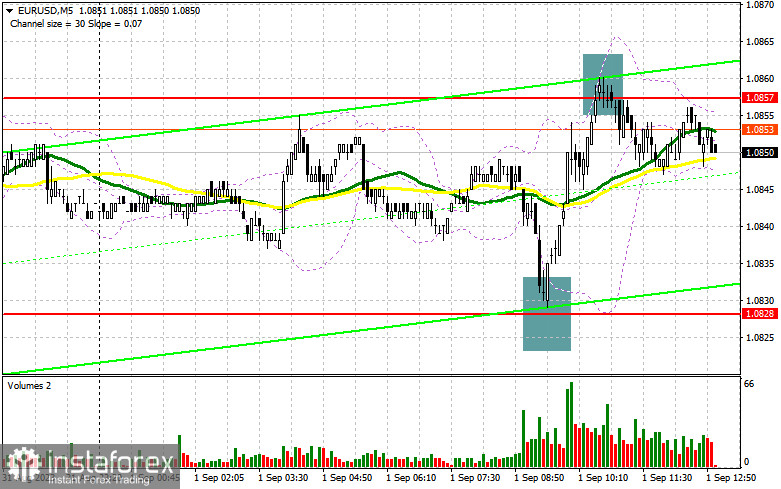
Long positions on EUR/USD:
The eurozone business activity index worsened in August compared to preliminary values. However, the pair's direction will entirely hinge on the non-farm payroll data and the US unemployment rate. These figures matter in the medium term, as the Fed bases future rate decisions on them. If the employment figures decrease more than economists expect, the US dollar may fall and the euro is likely to strengthen, possibly sparking discussions about US interest rate peaks. If the numbers outperform economists' predictions and labor market strength is demonstrated once again, this could lead to a larger drop in the second half of the day and even a return to weekly lows.
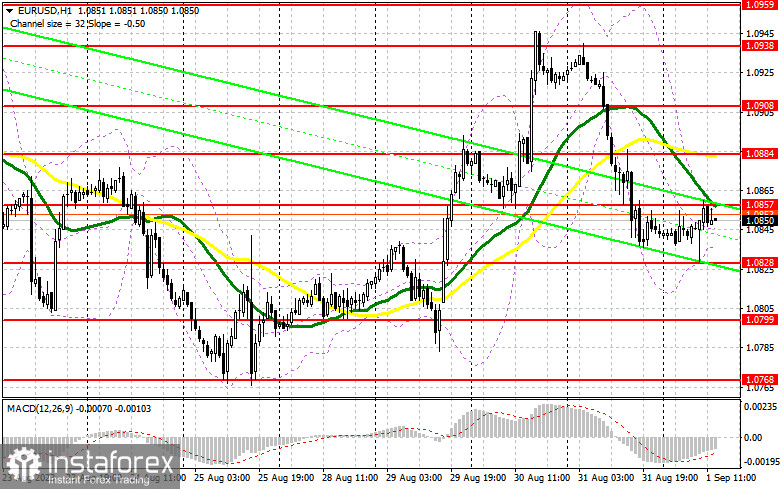
It is better to act on the downside after a false breakout near the support of 1.0828. This would provide an entry point for long positions with a target near the resistance of 1.0857, which was held after today's buying attempt. A breakthrough and a test of this level, given weak US statistics, would provide a chance to reach 1.0884, where moving averages support bears. The next target will be near 1.0908, where traders may lock in profits. If the pair declines and there is weak activity at 1.0828 in the second half of the day, bears will maintain control of the market. In that case, only a false breakout near 1.0799 may give a buy signal. One can also open long positions on a rebound from 1.0768, allowing an upward intraday correction of 30-35 pips.
Short positions on EUR/USD:
Bears attempted to drag the pair down but failed. However, defending 1.0857 maintained market equilibrium. Further movement depends on US data. Another defense of 1.0857 during data release, along with the previously discussed false breakout, would create a sell signal, opening the path to the support of 1.0828. Only after a breakthrough and fixing below this level, as well as a retest, we can expect another sell signal with the target of 1.0799, where larger buyers may enter the market. The next target would be near 1.0768, where traders may lock in profits. If the pair rises during the US session and bears show weak activity at 1.0857, it is better to postpone short positions until a new resistance at 1.0884. Selling is possible there, but only after an unsuccessful consolidation. You may consider short positions on a rebound from 1.0908, allowing a downward correction of 30-35 pips.
The COT report for August 22 logged that both long and short positions increased. Considering the release of weak US PMI index statistics indicating economic contraction, and hawkish comments from Fed Chairman Jerome Powell at the Jackson Hole symposium, it is unsurprising that short positions exceeded long ones. The euro decline is quite attractive, and buying risk assets on dips remains the optimal medium-term strategy. The COT report shows that non-commercial long positions increased by 6,925 to 239,391, while non-commercial short positions jumped by 8,028 to 80,028. As a result, the spread between long and short positions decreased by 3,173. The closing price dropped to 1.0866 from 1.0922, indicating a bearish market sentiment.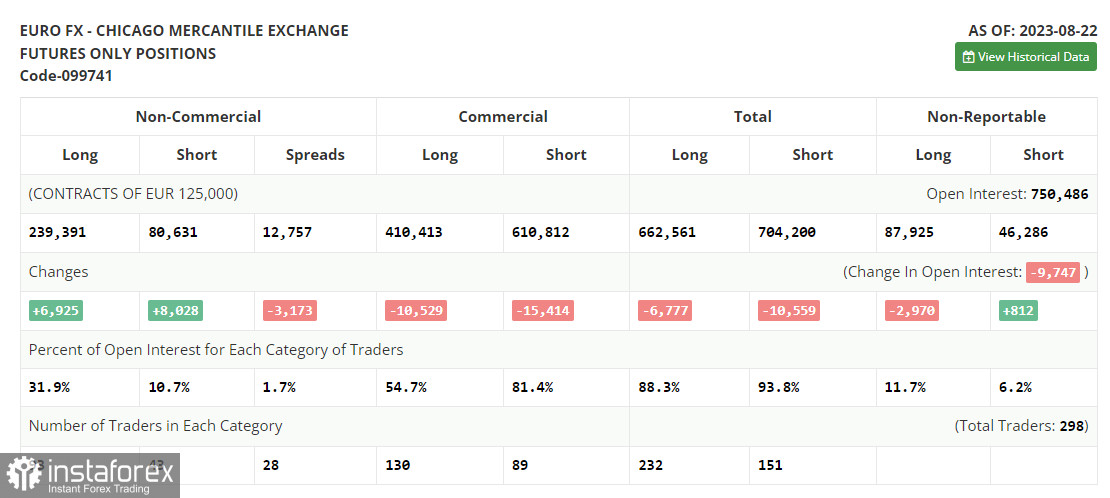
Signals of indicators:
Moving Averages
Trading occurs near the 30- and 50-day moving averages, signifying market confusion.
Note: The author considers the period and prices of moving averages on the hourly H1 chart, which differ from the classical daily moving averages on the daily D1 chart.
Bollinger Bands
In case of an uptrend, the upper boundary near 1.0945 will act as resistance.
Descriptions of indicators:
- Moving average defines the current trend by smoothing volatility and noise. Period 50. Marked in yellow on the chart.
- Moving average defines the current trend by smoothing volatility and noise. Period 30. Marked in green on the chart.
- MACD Indicator (Moving Average Convergence/Divergence). Fast EMA 12, Slow EMA 26, Signal SMA 9.
- Bollinger Bands. Period 20.
- Non-commercial traders: Speculators like individual traders, hedge funds, and institutions using futures markets for speculative purposes and meeting specific requirements.
- Long non-commercial positions represent the total long open position of non-commercial traders.
- Short non-commercial positions represent the total short open position of non-commercial traders.
- Net non-commercial position is the difference between short and long non-commercial positions.