EUR/USD

Higher Timeframes
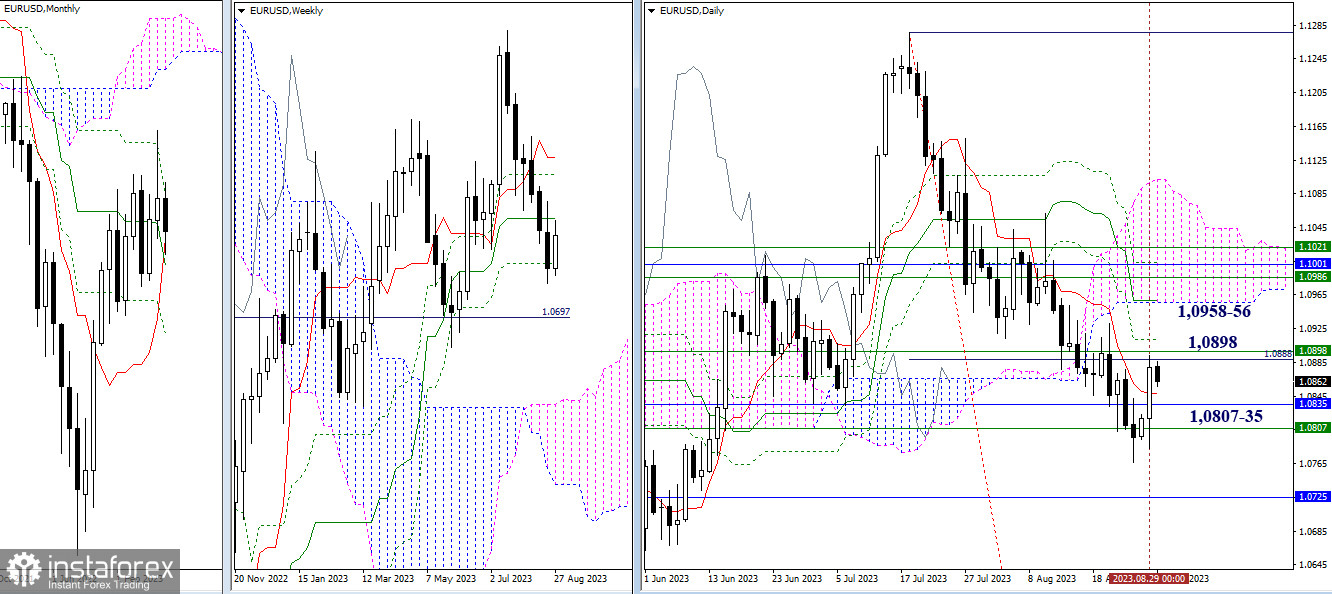
The attraction and influence encountered around the 1.0807–35 support levels managed to halt the decline. Bullish traders, taking advantage of this pause, began to recover their positions. Yesterday, they took control of the daily short-term trend and rose to challenge the resistance of the weekly medium-term trend (1.0898). The next resistances on the daily timeframe are now observed around the 1.0958–56 mark. With only two days left before the end of August, the outcome will be interesting. Will the newly emerging golden cross on the monthly timeframe herald a new upward trend? Or is the current bullish activity merely a residual phenomenon, anticipating a new significant phase of the downward trend?

H4 – H1
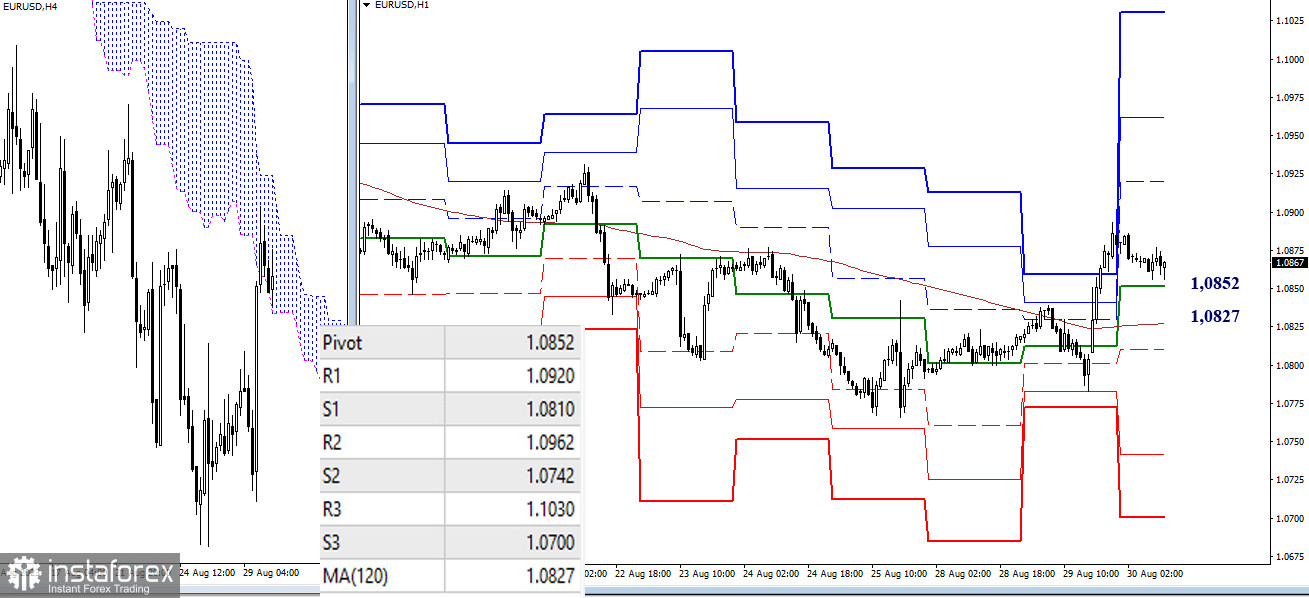
The corrective rise led to the loss of the weekly long-term trend, as well as the key level of the lower timeframes responsible for the current balance of power. As a result, the main advantage shifted towards the bulls, and to further develop bullish sentiment, it is advisable to continue the upward movement in the near term. The bullish targets within the day are now located at 1.0920 – 1.0962 – 1.1030 (classic pivot points). The key levels at this moment form a support zone within 1.0852 – 1.0827 (central pivot point + weekly long-term trend). If this zone is breached, bearish traders may return to the market, with targets at 1.0810 – 1.0742 – 1.0700 (support levels of classic pivot points).
***
GBP/USD

Higher Timeframes
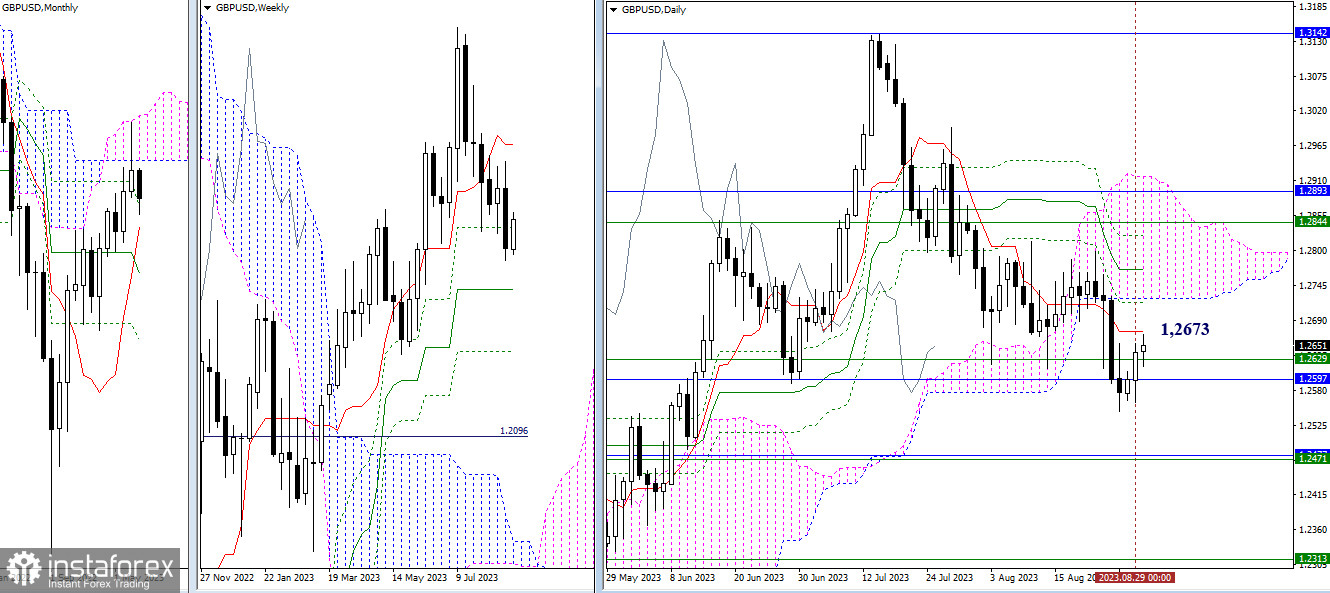
The attraction of the tested supports at 1.2597 – 1.2629 (monthly and weekly Fibo Kijun) is restraining the development of the movement. On the daily timeframe, the downward trend has shifted to a corrective bullish rally. The nearest bullish target is the resistance of the daily short-term trend (1.2673). Next, attention will shift towards the lower boundary of the daily cloud (1.2724). A break above the levels of 1.2597 – 1.2629 will pave the way to the next important level at 1.2471, where the weekly medium-term trend and monthly short-term trend converge.

H4 – H1
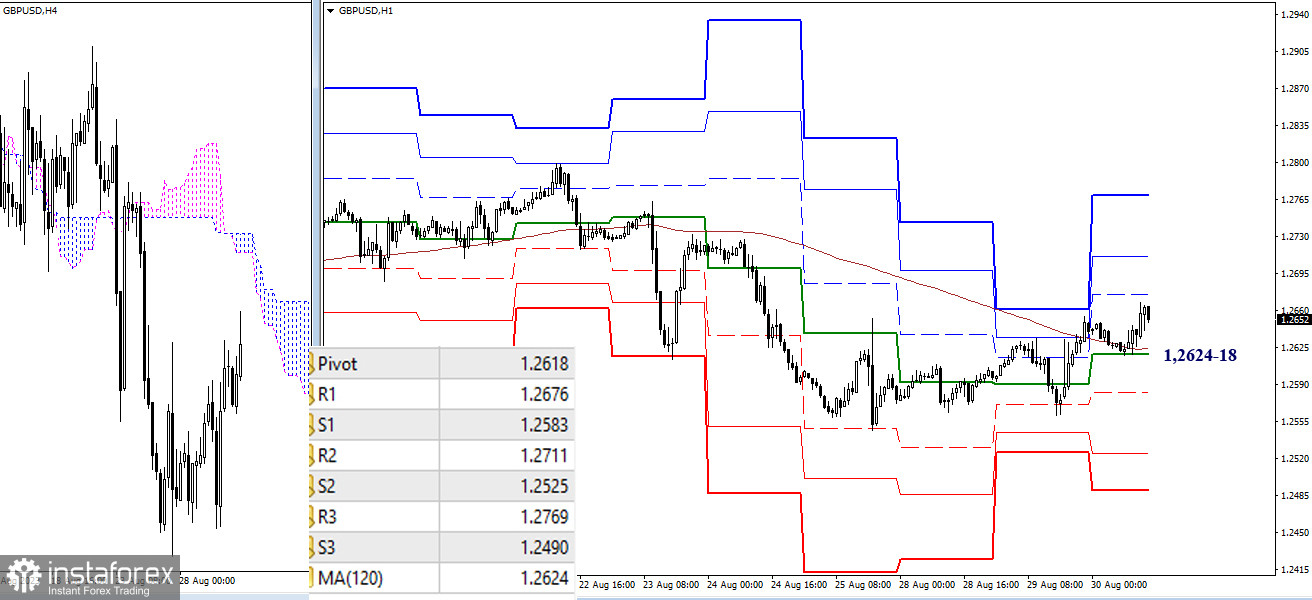
The daily corrective rally allowed prices to rise above the key levels of the lower timeframes, which today are located around 1.2624–18 (central pivot point + weekly long-term trend). Further strengthening of the bulls is possible by overcoming the resistance of the classic pivot points (1.2676 – 1.2711 – 1.2769). If the key level area (1.2624–18) is lost, bearish traders will return to the market, with targets at 1.2583 – 1.2525 – 1.2490 (supports of classic pivot points).
***
The technical analysis of the situation uses:
Higher timeframes - Ichimoku Kinko Hyo (9.26.52) + Fibo Kijun levels
Lower timeframes - H1 - Pivot Points (classic) + Moving Average 120 (weekly long-term trend)
 English
 Русский
 Bahasa Indonesia
 Bahasa Malay
 ไทย
ไทย Español
 Deutsch
 Български
 Français
 Tiếng Việt
 中文
中文 বাংলা
বাংলা हिन्दी
 Čeština
 Українська
 Română

