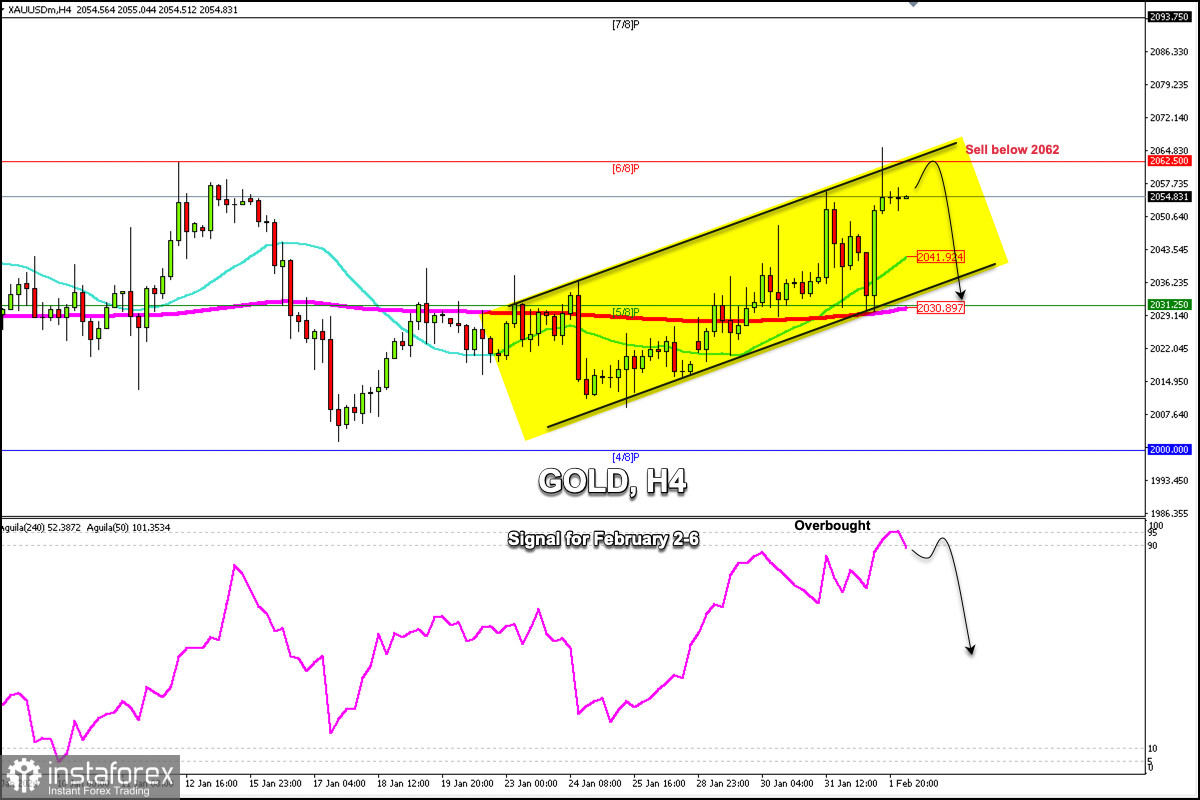
Gold is trading around 2,053.35, below 2/8 Murray, and above the moving averages of 200 and 21. Yesterday during the American session, gold bounced strongly above the 200 EMA and above 5/8 Murray after the US data.
On the H4 chart, we can see that gold is trading within the uptrend channel forming since January 24. In the next few hours, the metal is likely to continue its rise but could face strong resistance located around 2,062.
Technically, gold is strongly overbought. So, if it fails to consolidate above 2,063 in the coming days, it could be seen as a signal to sell with the target at 2,041 area (21 SMA). Additionally, if there is a sharp break in the uptrend channel, the instrument could cover the GAP that it left on January 26 around 2,018.
Yesterday during the European session, gold fell sharply but the 200 EMA gave it strong support. After the price had hit the bottom of the bullish trend channel, it gained strong momentum, achieving an accumulation of more than $30 in profit until reaching the weekly high of 2,065. This is a sign that gold could continue to rise in the coming days.
We believe that gold could make a technical correction in the next few hours and could find first support around 2,041. In case this level is broken, gold should find strong support at 2,030. In case gold breaks below this area, the price could have a bearish acceleration. Thus, the instrument could reach the psychological level of $2,000 in the coming days.
Meanwhile, we believe that any technical bounce and as long as gold trades above 2,035 will be seen as a signal to buy. Gold will come under bearish pressure below 2,062 and below 2,030.
 English
 Русский
 Bahasa Indonesia
 Bahasa Malay
 ไทย
ไทย Español
 Deutsch
 Български
 Français
 Tiếng Việt
 中文
中文 বাংলা
বাংলা हिन्दी
 Čeština
 Українська
 Română

