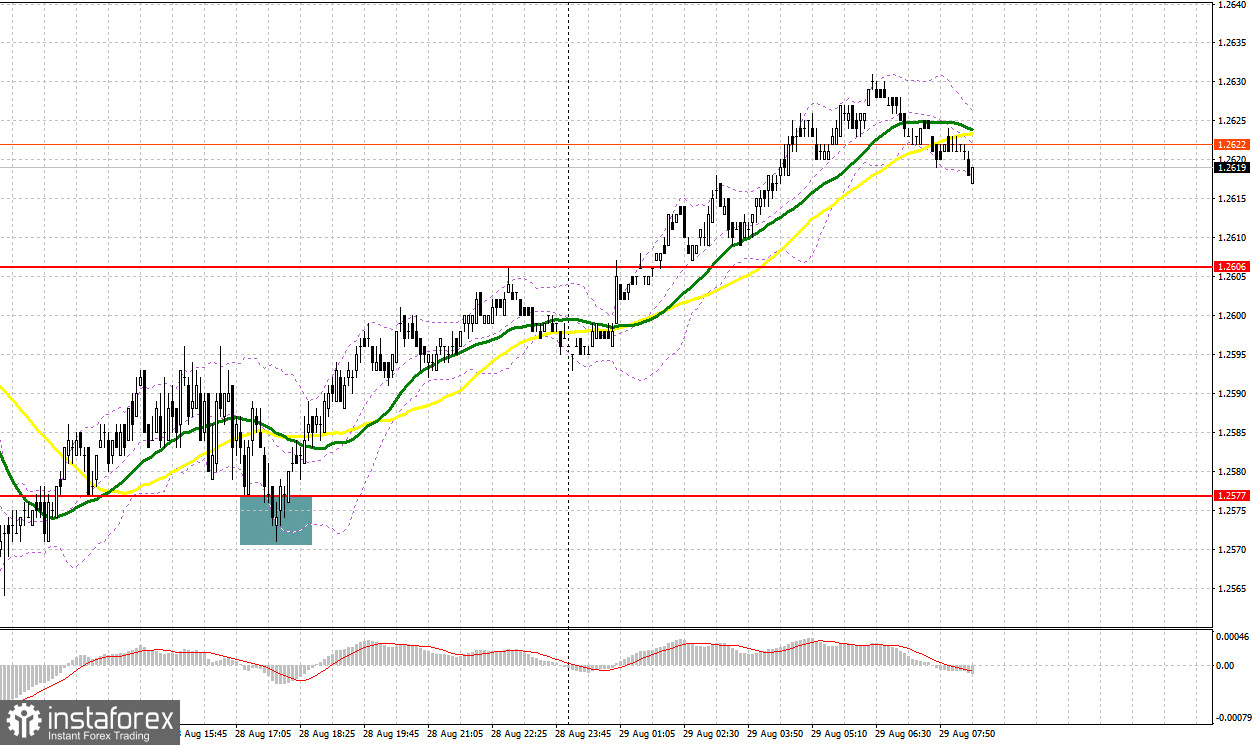
Yesterday, several market entry signals were formed. Let's have a look at the 5-minute chart and analyze the situation. In the previous forecast, I drew your attention to the level of 1.2578 and recommended entering the market from it. The pair decreased and formed a false breakout at this level. This led to an entry point for long positions, but as you can see on the chart, the pound failed to recover. In the second half of the day, a rebound from 1.2577 and another false breakout at this level provided another entry point for long positions. This time, the upward movement exceeded 30 pips.
Long positions on GBP/USD:
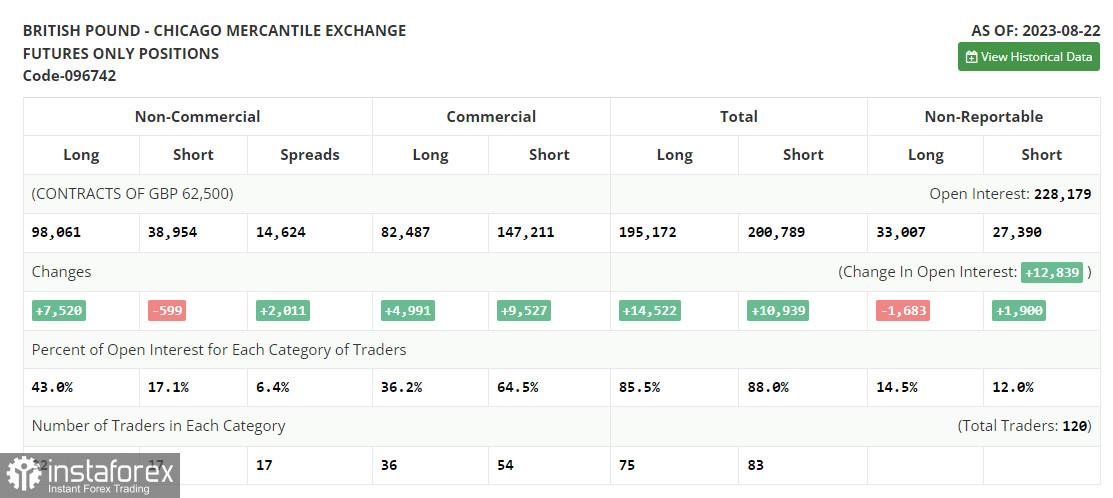
Before analyzing the technical picture of the pound, let's look at what happened in the futures market. In the COT report for August 22, there was an increase in long positions and a decrease in short positions. Traders continued to increase their purchases as the pound declined after recent positive UK GDP data. However, the PMI statistics, along with Federal Reserve Chairman Jerome Powell's speech indicating further rate hikes in the US, led to new monthly lows. Yet, buyers quickly took advantage of this, as a lower pound is more attractive for medium-term purchases. The difference in central bank policies will continue to positively affect the pound/dollar pair. The latest COT report reads that non-commercial long positions increased by 7,520 to 98,061, while non-commercial short positions decreased by 599 to 38,954. As a result, the spread between long and short positions increased by 2,011. The weekly price rose to 1.2741 from 1.2708.

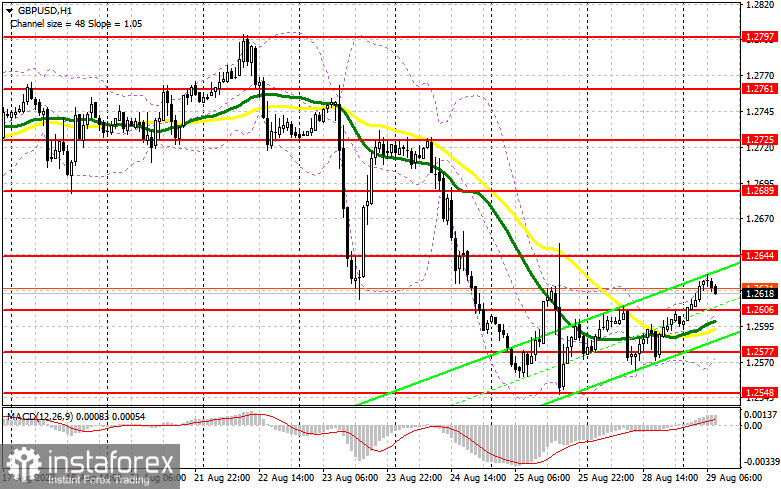
Today, there is no UK data, so the pound has a good chance of continuing the upward correction observed during the Asian session. However, I prefer to act on a decline after a false breakout near the new support at 1.2606. Just below this level, the moving averages, favoring bulls, provide an excellent entry point for targeting growth towards the resistance at 1.2644, which was not breached last Friday. Breaking and testing the upper range may form an additional buy signal, strengthening the pound and allowing it to reach a new high of 1.2689. In case of a breakout above this range, aiming for 1.2725 would be plausible, where traders may take profits. If the pair falls and bulls show weak activity at 1.2606, the pair will likely trade within a sideways channel, with bears having the upper hand. If that occurs, it is better to postpone long positions until the pair reaches 1.2577, only buying on a false breakout. Opening long positions on GBP/USD immediately on a rebound is possible from 1.2548, allowing an intraday correction of 30-35 pips.
Short positions on GBP/USD:
Yesterday, bears did everything they could, but they failed to reach the monthly lows. Demand for the pound increased with every downward movement. Today, in the first half of the day, it would be good to keep the pair below 1.2644. A false breakout at this level forms a sell signal, anticipating a decline to the support at 1.2606, established from yesterday, where a real struggle will unfold. Breaking and testing the lower range of this would give bears an advantage, providing an entry point for selling to reach 1.2577. A more distant target would be the area around 1.2548, where traders may lock in profits. If the pair rises and bears show weak activity at 1.2644, bulls will maintain control, leading to an ascending correction. In this case, only a false breakout near the next resistance at 1.2689 may give an entry point for short positions. If there is little activity there, it is better to sell the pound from 1.2725, expecting an intraday rebound of 30-35 pips.

Signals of indicators:
Moving Averages
Trading occurs above the 30- and 50-moving averages, indicating further pound recovery.
Note: The author considers the period and prices of moving averages on the hourly chart (H1), which differ from the general definition of classical daily moving averages on the daily chart (D1).
Bollinger Bands
In case of an increase, the upper boundary of the indicator around 1.2630 will serve as resistance. In case of a decrease, the lower boundary around 1.2580 will provide support.
Descriptions of indicators:
- Moving Average defines the current trend by smoothing volatility and noise. Period 50. Marked in yellow on the chart.
- Moving Average defines the current trend by smoothing volatility and noise. Period 30. Marked in green on the chart.
- MACD Indicator (Moving Average Convergence/Divergence). Fast EMA 12. Slow EMA 26. SMA 9.
- Bollinger Bands: Period 20.
- Non-commercial traders: Speculators like individual traders, hedge funds, and large institutions using the futures market for speculative purposes and adhering to specific requirements.
- Long non-commercial positions represent the total open long positions of non-commercial traders.
- Short non-commercial positions represent the total open short positions of non-commercial traders.
- Total non-commercial net position is the difference between short and long non-commercial positions.
 English
 Русский
 Bahasa Indonesia
 Bahasa Malay
 ไทย
ไทย Español
 Deutsch
 Български
 Français
 Tiếng Việt
 中文
中文 বাংলা
বাংলা हिन्दी
 Čeština
 Українська
 Română

