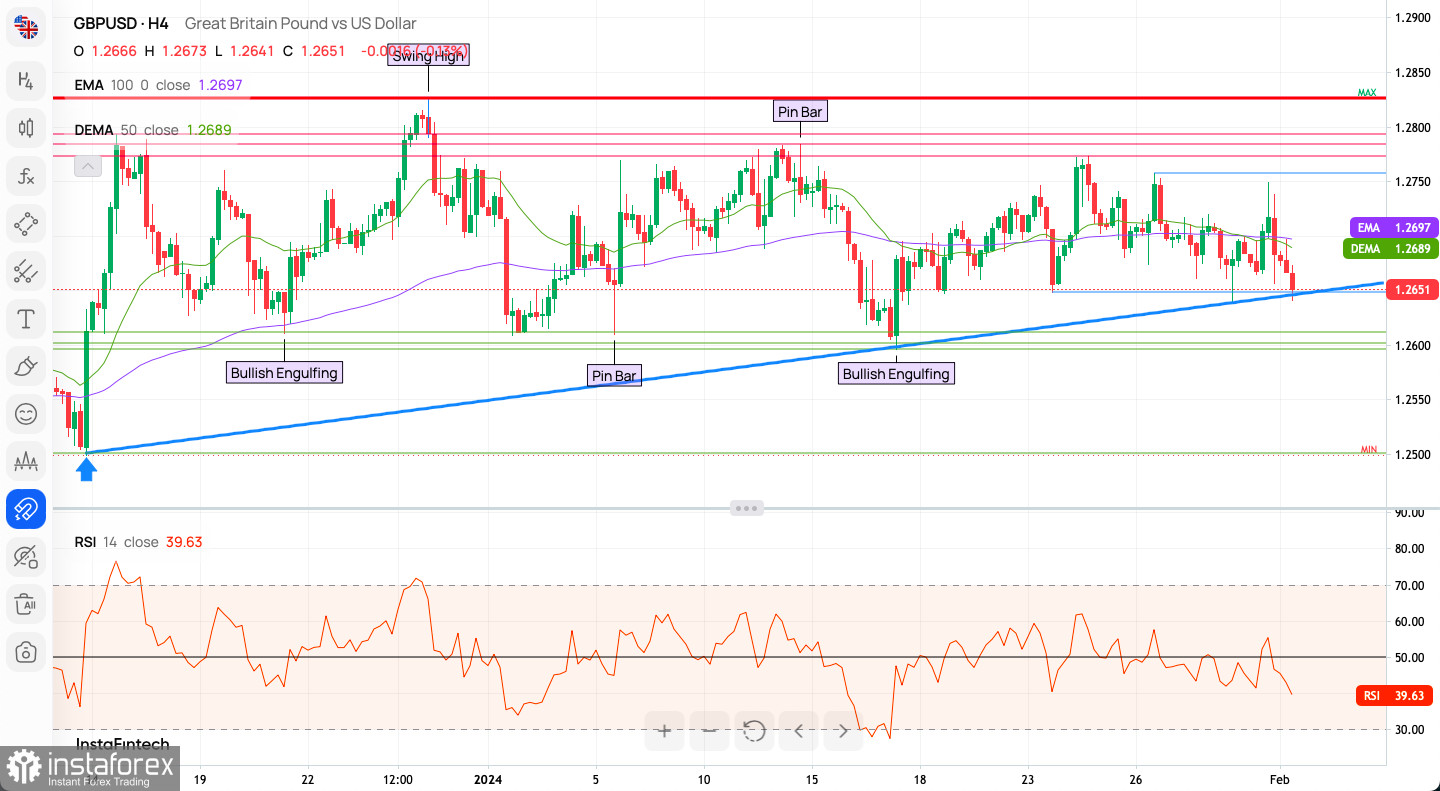
GBP tests the key trend line support ahead of BoE interest rate decision
Key Takeaways:
- Mixed signals in candlestick patterns require careful consideration.
- Consolidation indicated by moving averages and RSI near neutral.
- Watch for pivot point breaches for directional clues.

H4 Time Frame Technical Market Outlook:
The GBP/USD pair's descent from 1.2757 persists as bears test the short-term trend line support around 1.2641. The bear's next target is the local low at 1.2639. Resistance lies at 1.2757 and 1.2773. With the H4 chart's momentum near the neutral fifty mark, the short-term outlook could shift to neutral or negative. Key support is between 1.2615 and 1.2595; breaching this zone could turn the outlook more bearish.
Technical Insights:
Trend: The price is in a range, shown by horizontal support and resistance. This suggests consolidation.
Candlestick Patterns: Bullish and bearish engulfing patterns and pin bars present mixed signals.
Moving Averages: The price between 50-period DEMA and 100-period EMA suggests uncertainty. These averages' proximity indicates consolidation.
RSI: The RSI at 48.92 leans slightly bearish but remains near neutral.
GBP/USD H1 Intraday Indicator Signals:
- Sell: 18 of 21 technical indicators
- Neutral: 3 indicators
- Sell: 18 of 18 moving averages

Sentiment Scoreboard:
- Bullish: 58% (vs. 42% bears)
- Last week: 56% bullish (vs. 44% bears)
- Last three days: Shift to 48% bullish (vs. 52% bears)
Weekly Pivot Points:
- WR3: 1.27609
- WR2: 1.27332
- WR1: 1.27202
- Pivot: 1.27055
- WS1: 1.26925
- WS2: 1.26778
- WS3: 1.26501
Bullish Scenario:
A rise above DEMA and EMA, with these averages turning up, suggests bullishness, especially with increased volume. Breaking above upper resistance with the RSI over 50 indicates growing bullish momentum. Ongoing bullish candlestick patterns, like bullish engulfings, support an upward move.
Bearish Scenario:
A break below support hints at a bearish trend, with DEMA and EMA becoming dynamic resistance. An RSI drop below 40 would confirm bearish momentum. More bearish engulfings or a sharp decline following a pin bar rejection could signal a potential downtrend.
In conclusion, GBP/USD traders should monitor for a decisive breakout or breakdown from the current consolidation phase. Bulls look for a sustained move above key moving averages, while bears anticipate a break below support levels. Stay vigilant for changes in sentiment and technical indicators to navigate the market effectively.
Useful Links
Important Notice
The begginers in forex trading need to be very careful when making decisions about entering the market. Before the release of important reports, it is best to stay out of the market to avoid being caught in sharp market fluctuations due to increased volatility. If you decide to trade during the news release, then always place stop orders to minimize losses.
Without placing stop orders, you can very quickly lose your entire deposit, especially if you do not use money management and trade large volumes. For successful trading, you need to have a clear trading plan and stay focues and disciplined. Spontaneous trading decision based on the current market situation is an inherently losing strategy for a scalper or daytrader.
 English
 Русский
 Bahasa Indonesia
 Bahasa Malay
 ไทย
ไทย Español
 Deutsch
 Български
 Français
 Tiếng Việt
 中文
中文 বাংলা
বাংলা हिन्दी
 Čeština
 Українська
 Română

